Skip to content

Last Updated: November 5, 2026
Key Engineering Takeaways
- Compare peak, RMS and whole-cycle average charging current with the rating conditions.
- Estimate bridge loss for both conducting junctions and validate the installed thermal path.
- Evaluate non-repetitive startup surge separately from steady-state pulses.
Evaluate a capacitor-input bridge by measuring average, RMS and peak charging current, then relating those quantities to the datasheet rating and cooling conditions. A 25 A part is not automatically suitable for a 25 A supply: its current rating depends on the manufacturer’s specified cooling and waveform conditions. Begin with the AC input stage, then verify the candidate with the latest datasheet and the assembled power supply.
Start with the front-end circuit
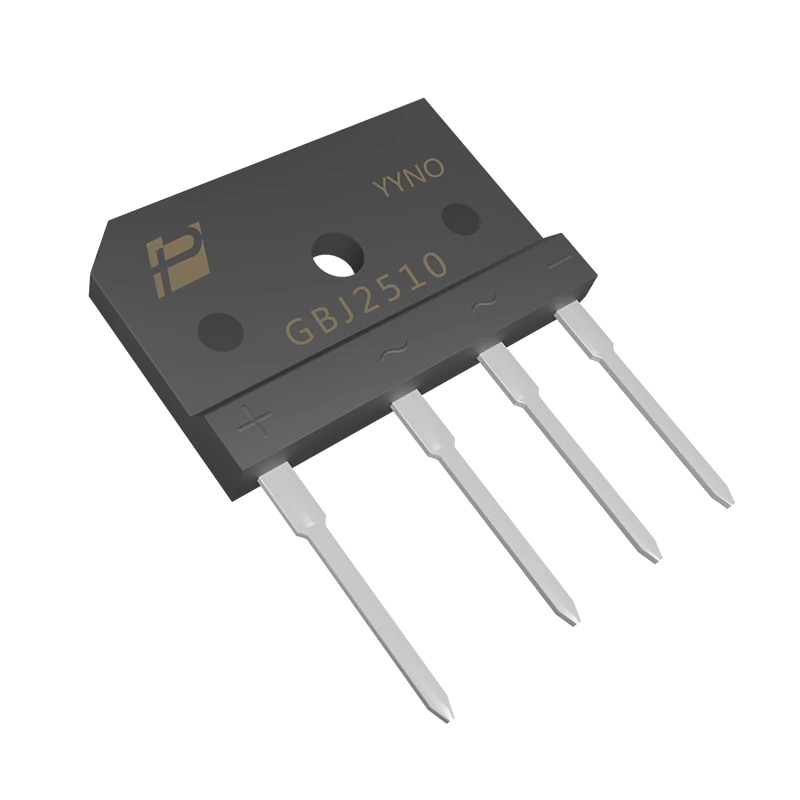
A single-phase bridge has two AC terminals and positive and negative DC outputs. Two diode junctions carry the load current on each conducting path. With a bulk capacitor after the bridge, current flows in charging pulses around the line-voltage peaks; the bridge and capacitor may therefore see a much higher RMS current than a simple DC-output-current estimate suggests. A PFC stage, input impedance or transformer changes the waveform again.
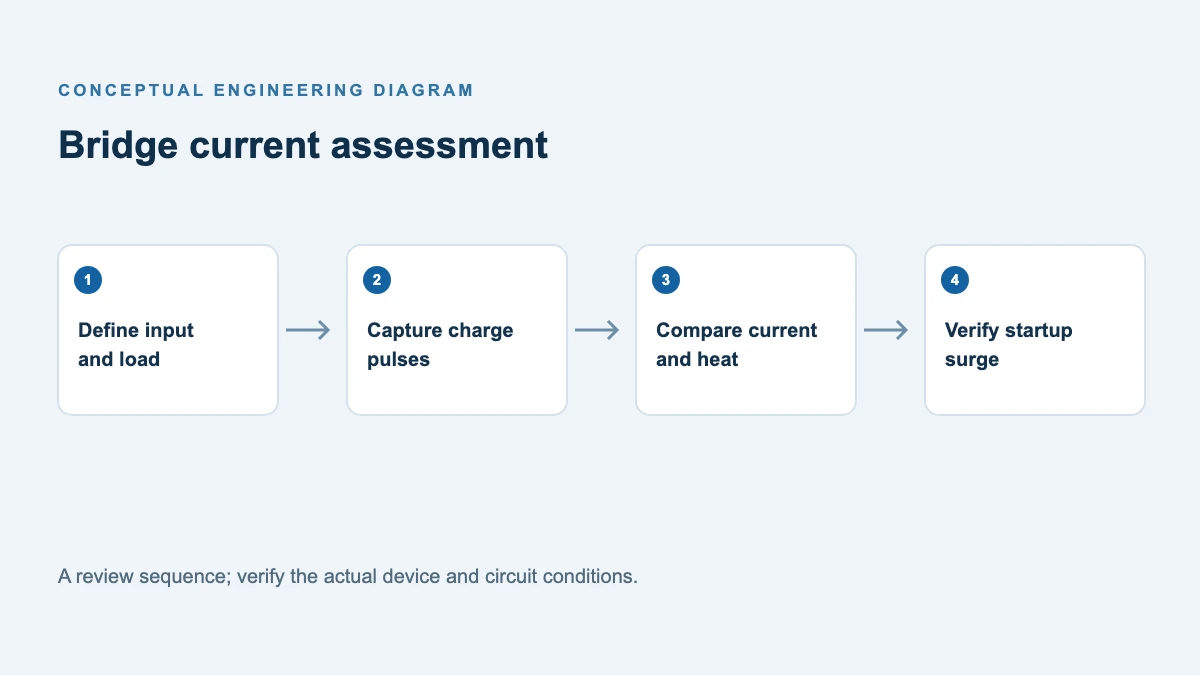
Record minimum and maximum AC input, frequency, DC-link capacitance, power and duty cycle, ambient temperature inside the enclosure, cooling method, and the startup and restart sequence. Capture or simulate the bridge current at the worst relevant combinations, including low line and maximum load. Use the measured waveform for loss and temperature checks.
Average and RMS current answer different questions
Suppose, purely as an illustration, the magnitude of the conducting-path current is a rectangular 10 A pulse for 20% of each repeating period and zero otherwise. Over a whole period its average is 10 × 0.20 = 2 A, while its RMS value is 10 × √0.20 = 4.47 A. The peak remains 10 A. With symmetric half cycles each individual diode conducts on alternate pulses; do not confuse its average with the whole bridge path average. A real capacitor-input pulse is not rectangular, so compute average and RMS by integrating the captured waveform over complete line cycles. This example is not a GBJ2510 operating limit.
Average current helps estimate constant-drop conduction loss; RMS current describes resistive heating in conductors and the current waveform; peak current informs instantaneous device stress. No single measure establishes suitability. For a non-linear diode, estimate bridge loss by averaging 2 × VF(i, T) × |i| over time, taking care to use an appropriate temperature and VF characteristic. Check available current and thermal derating according to the manufacturer’s defined test waveform.
For a practical recording, measure bridge path current with an appropriately rated isolated current probe or properly designed shunt and differential measurement. Set bandwidth and sample rate to resolve charging peaks without clipping. Capture complete line cycles after stabilization, then export the waveform to calculate average of its magnitude, RMS and peak. Record source voltage, load, line frequency, capacitor, source impedance, probe limits and local temperatures. Repeat at low and high line, at relevant load extremes, and with the production input wiring. A power analyzer’s input RMS reading is useful but does not replace the peak waveform or reveal how its measurement relates to a datasheet’s average-current test.
For a broader first estimate from converter power, see Bridge Rectifier Selection From Power. The present analysis begins after that estimate, with measured capacitor-charging pulses.
Compare the ratings under their test conditions
| Check | What to compare | Common mistake |
|---|---|---|
| Reverse voltage | Maximum repetitive reverse voltage including the circuit’s ringing and tolerances | Using nominal AC RMS voltage as the entire voltage stress |
| Operating current | Manufacturer’s current definition and derating curve versus actual case temperature and current waveform | Treating the headline current as an unrestricted free-air rating |
| Power and cooling | Both conducting junctions, junction-to-case and interface paths, heat sink and local air temperature | Using one diode drop or assuming a cold chassis |
| Startup surge | Pulse amplitude, duration, repetition, initial junction temperature and the available surge curve | Comparing a recurring charge pulse with a single-pulse IFSM number |
| Mechanical fit | Pin order, lead geometry, mounting, insulation and clearances | Assuming similar bridge package names mean identical parts |
For a first voltage check, convert the maximum sinusoidal AC RMS input to its peak, then include credible overshoot and tolerances. Confirm the actual maximum reverse voltage across each diode by analysis or measurement; non-sinusoidal input, transformer effects and fault conditions can change the result. Select a voltage class with margin appropriate to the equipment and applicable design rules.
Interpret the GBJ2510 correctly
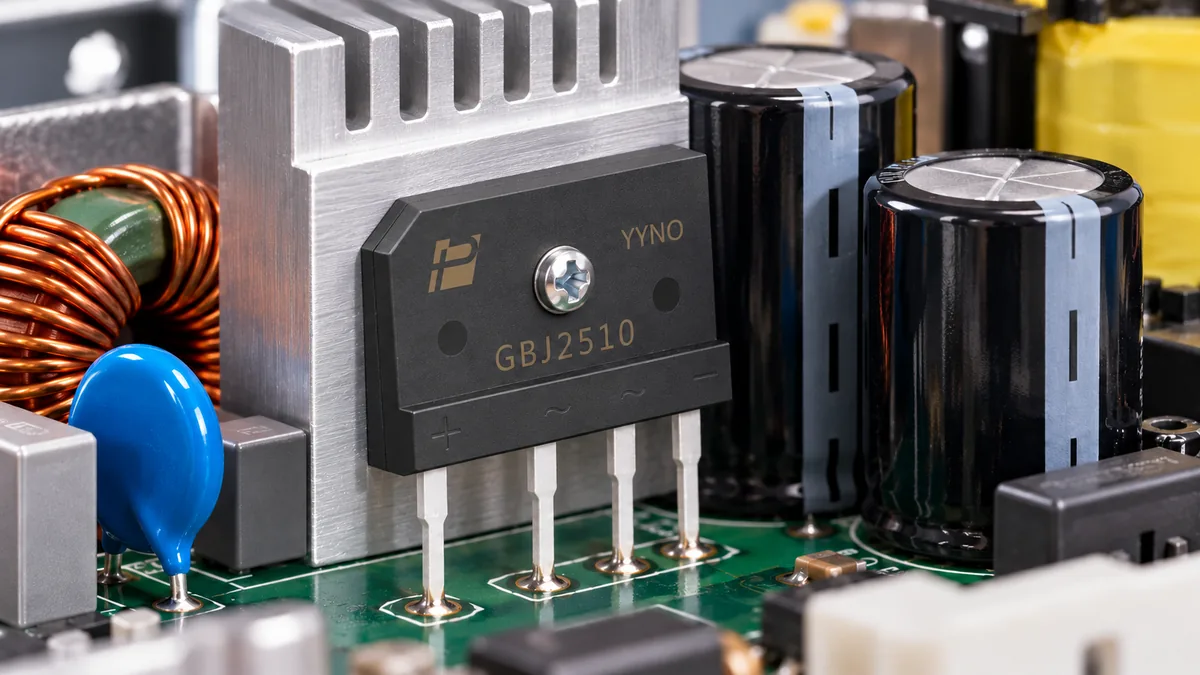
The POWERSi GBJ2510 is a 1000 V single-phase bridge. Its version 2.0 datasheet specifies 25 A with a heat sink at a 110 °C case temperature, and a 320 A non-repetitive single surge pulse for 8.3 ms. These are separate test conditions, not simultaneous guarantees for every load. The sheet also lists 4 A without a heat sink at Tc = 25 °C as printed; confirm the temperature reference and test conditions with POWERSi before applying that figure. Neither number alone substitutes for a thermal test of the finished assembly.
The datasheet’s 1.1 V maximum forward voltage is specified at 12.5 A and 25 °C junction temperature. Do not multiply that single point by arbitrary peak current and claim a guaranteed loss. Instead, use the relevant forward characteristic and actual conduction waveform. For a rough estimate with a nearly constant forward drop, two conducting junctions give P ≈ 2 × VF × average conducting-path current; pulsed current and temperature-dependent VF require a waveform-based calculation. The result is a starting estimate, not a guaranteed maximum.
If reverse leakage matters to the design, confirm its test conditions as well. The product-page summary lists 250 μA typical at 125 °C without stating reverse voltage there; the version 2.0 datasheet summary lists 50 μA typical at 1000 V and 125 °C. Because the published conditions are not fully matched, ask POWERSi for the controlled specification and measurement conditions rather than treating these values as directly comparable.
Check startup and repeated inrush separately
An uncharged DC-link capacitor can draw a large transient. Its value depends on line phase at switch-on, source impedance, wiring, temperature and any NTC, resistor, relay or active precharge circuit. A hot NTC following a short interruption can give a different result from a cold start. Measure cold start, hot restart and the worst switching phase, and account for repeated starts and brownout recovery.
The 320 A / 8.3 ms IFSM value describes the stated non-repetitive test. It is not a continuous or repetitive current allowance. Use the pulse and cycle information in the datasheet where applicable, and obtain supplier guidance if the measured waveform does not match it. Coordinate the bridge check with fuse, precharge and capacitor ratings; passing the bridge alone does not validate the complete protection scheme.
Qualify the assembly
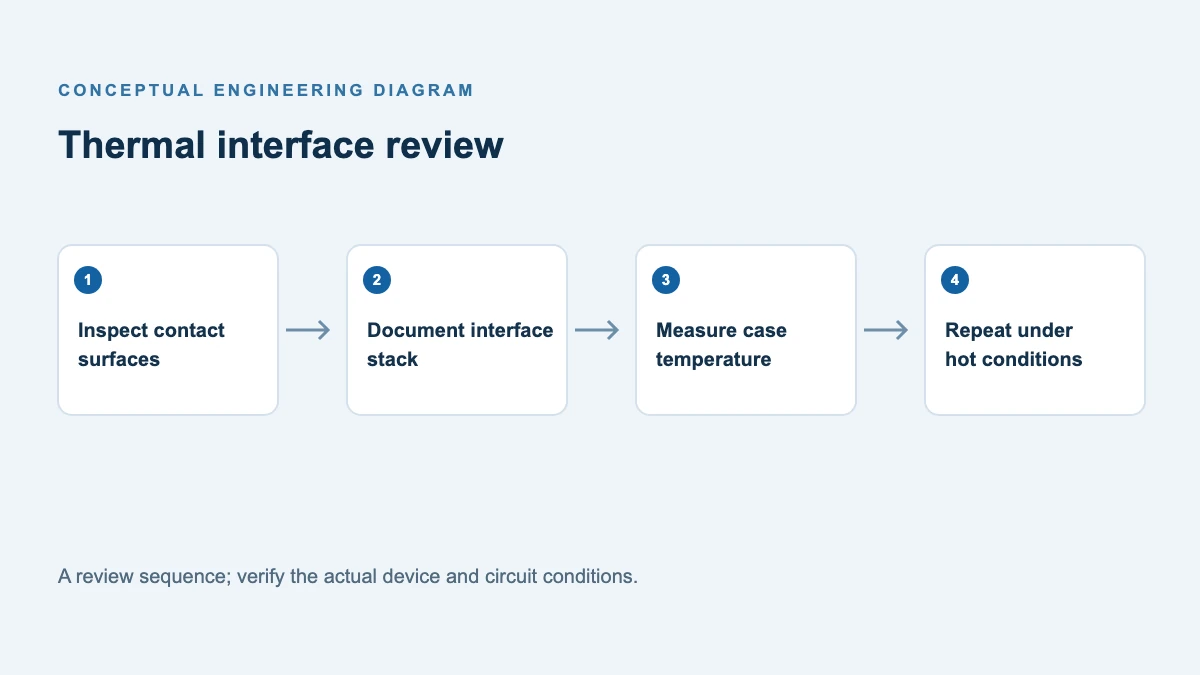
Mount the bridge according to the approved outline, contact surface, interface material and torque instructions. Check case temperature at a defined location after thermal equilibrium at high local ambient, worst load and airflow. Evaluate junction temperature with the appropriate thermal model and margin, then verify lead and PCB temperatures. Test short interruptions, startup and abnormal operating modes in the complete equipment. The terminal-to-case dielectric value does not make the AC-to-DC conversion galvanically isolated.
Review the GBJ2510 bridge rectifier details with the applicable datasheet. Before procurement, confirm the exact package and lead variant, drawing revision, compliance documentation, lot requirements and expected demand. For an application review, provide the AC range, current waveform, DC-link capacitor, cooling arrangement and startup waveform to POWERSi.
FAQ
Can I choose a bridge using only the DC output current?
No. DC output current is a starting point. Capacitor charging produces pulses; compare the bridge’s current definition, RMS and peak stresses, losses and case temperature with the actual circuit.
Is a higher voltage bridge always a direct replacement?
No. Check forward loss, surge rating, cooling, footprint, terminal order and insulation as well as the voltage rating. Validate the candidate in the equipment.
Does the surge rating cover repetitive restarts?
A single-pulse IFSM rating does not by itself establish repetitive restart capability. Compare the real waveform and repetition with the datasheet’s applicable curves and consult the manufacturer where necessary.
Can I use the bridge datasheet current rating without checking the cooling condition?
No. The rating applies to the stated waveform, mounting and temperature conditions. Compare those conditions with the actual current and thermal environment.