Skip to content
Bridge Rectifier Selection From Power: Calculate Current, Voltage and Heat
Last Updated: 2026-09-26
Quick Answer
Bridge rectifier selection from power begins with the circuit location, input range, efficiency and power factor. Output watts alone do not determine the required current rating or reverse voltage. Estimate the input RMS current, then evaluate the rectifier’s actual waveform, cooling conditions, startup surge and worst-case reverse stress before selecting a device.
A 500 W output does not imply a 500 W rectifier, nor does dividing 500 W by a nominal line voltage finish the selection. The bridge sees input-side current, which changes with line voltage and the power supply architecture.
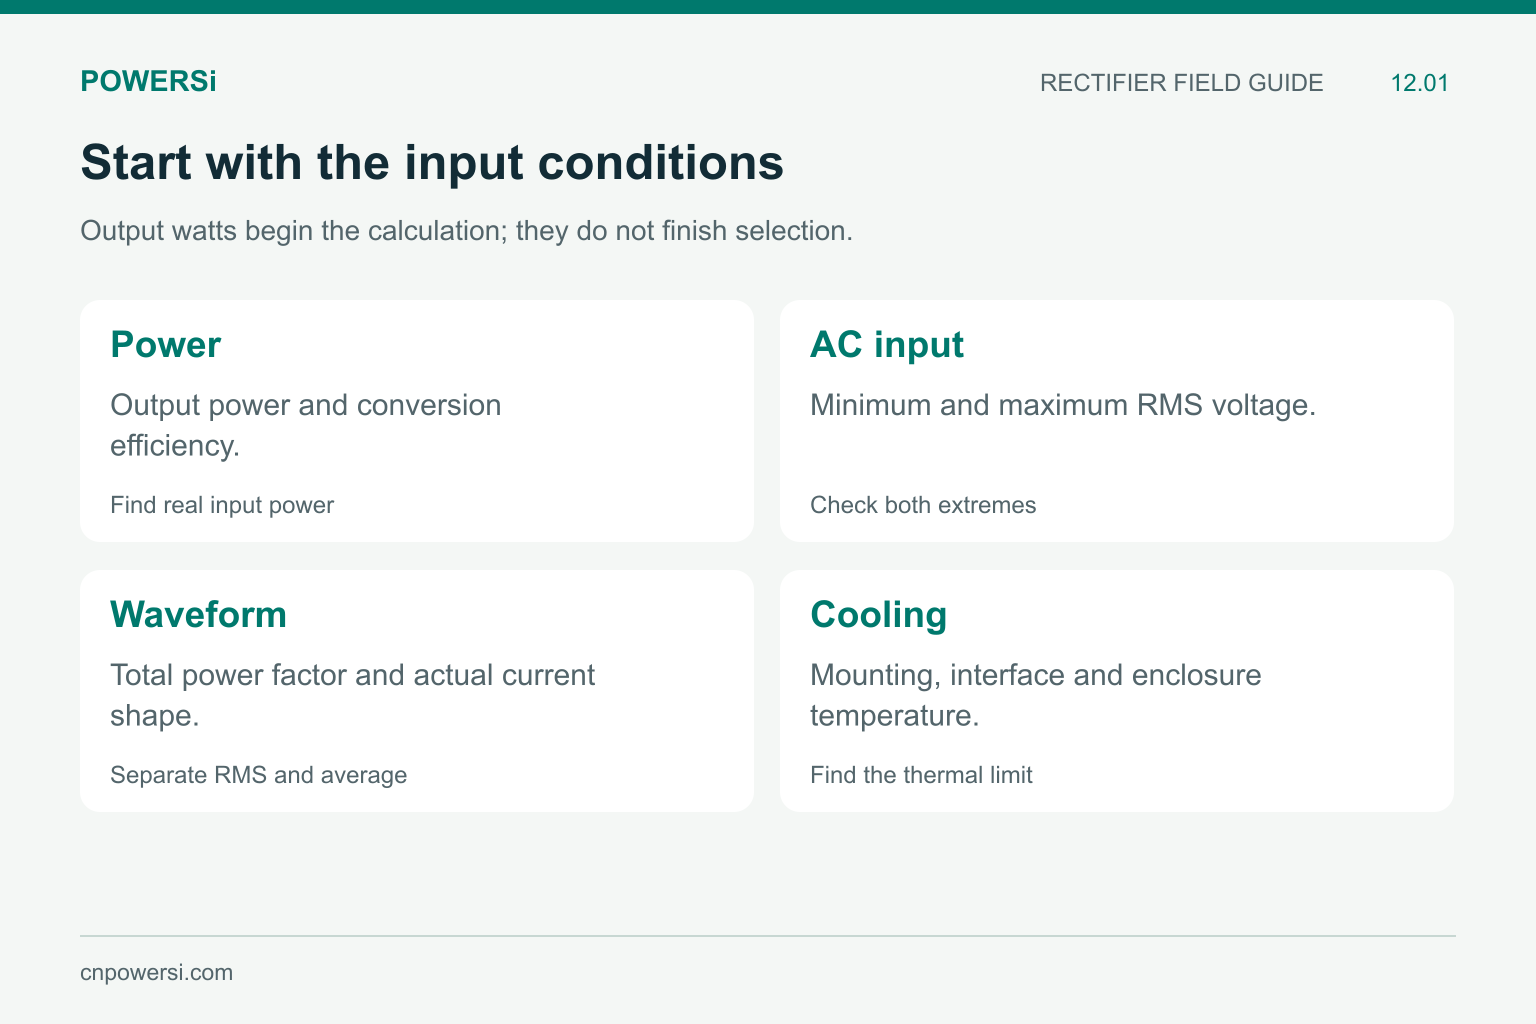
A wattage alone does not define the bridge requirement.
Start With an Input-Power Calculation
For a single-phase AC input, total power factor relates real input power to RMS voltage and RMS current. If output power is Pout, efficiency is eta and total power factor is PF, the estimate is:
Iin,rms = Pout / (eta × Vin,rms × PF)
Consider a hypothetical 500 W converter at 90% efficiency and 0.95 total power factor. At 230 V RMS, the estimate is 2.54 A RMS. At 90 V RMS, it is 6.50 A RMS, assuming the same efficiency and power factor. These are calculation examples, not guaranteed performance values for a POWERSi device.
In a real design, efficiency and power factor may change with voltage and load. Evaluate those changes rather than assuming the high-line values still apply at low line. For distorted current, use total power factor, not just the cosine of the displacement angle.
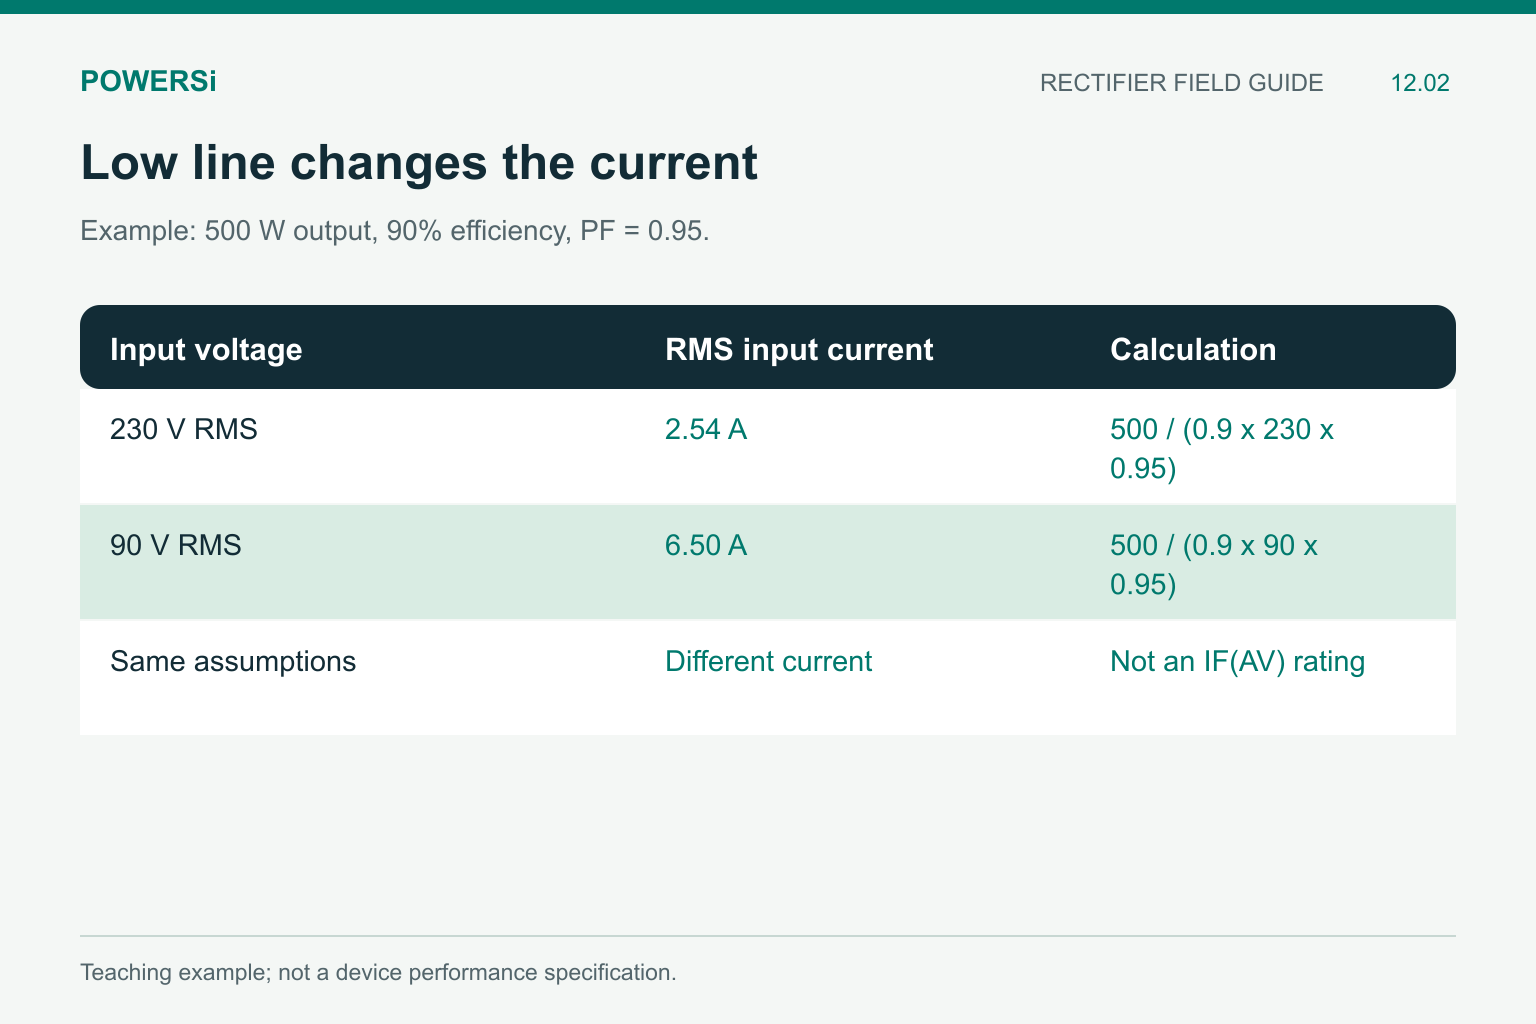
Illustrative calculation; efficiency and power factor may change with line voltage.
Translate Line Current Into Device Stress
The calculation produces input RMS current. A bridge’s advertised average rectified current is a different quantity with stated thermal and waveform conditions. Do not compare those numbers as though their definitions were identical.
In a capacitor-input supply, charging can occur in narrow current pulses around line-voltage peaks. Peak and RMS currents can be substantially higher than a smooth-current assumption suggests. An active PFC stage changes the waveform, but does not remove startup or thermal requirements. Simulate or measure the bridge current across the operating range.
During normal conduction through a conventional bridge, two diode junctions are in series. A first loss estimate uses the average of 2 × VF(i,T) × |i| over time. A fixed forward drop can support early screening, but it does not capture the nonlinear voltage drop over a pulsed waveform.
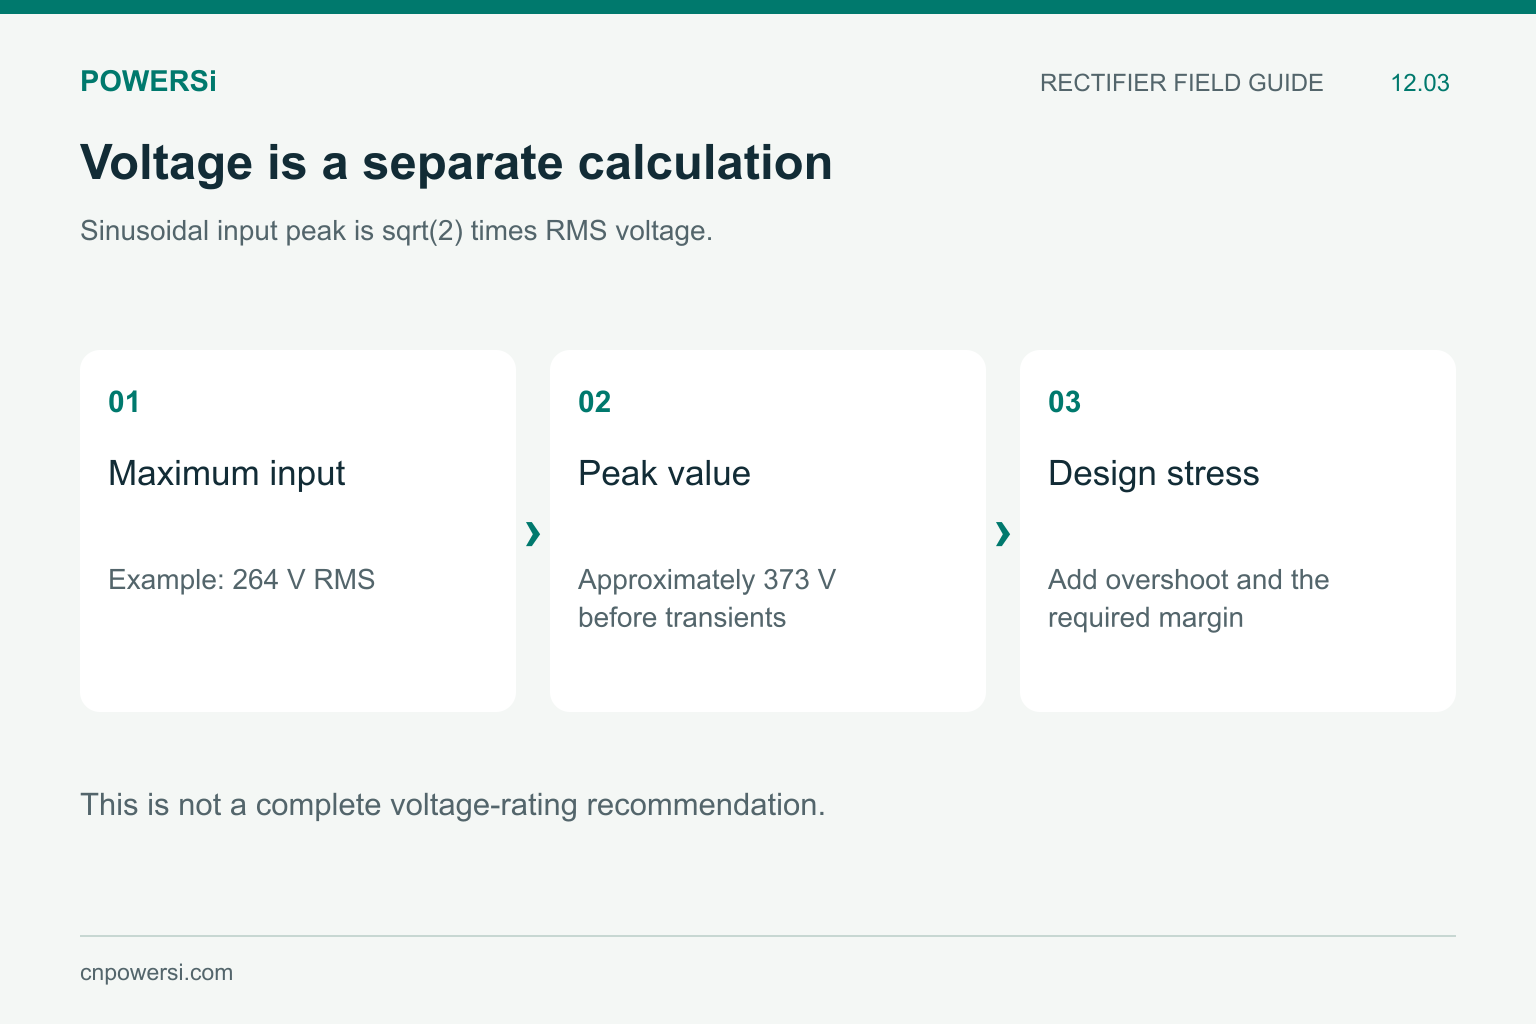
Power does not determine reverse-voltage capability.
Establish Reverse Voltage Separately
Start from the maximum AC input, its tolerance and the topology. For a sinusoidal source, peak voltage is sqrt(2) times RMS voltage. A hypothetical 264 V RMS maximum corresponds to about 373 V peak before transients. This is a starting stress calculation, not a complete voltage-rating recommendation.
Include measured or bounded overshoot and the protection circuit’s clamping behavior. The bridge’s repetitive reverse-voltage rating must accommodate the design stress with the required margin. Output power does not specify that margin, and a fixed watts-to-volts conversion does not exist.
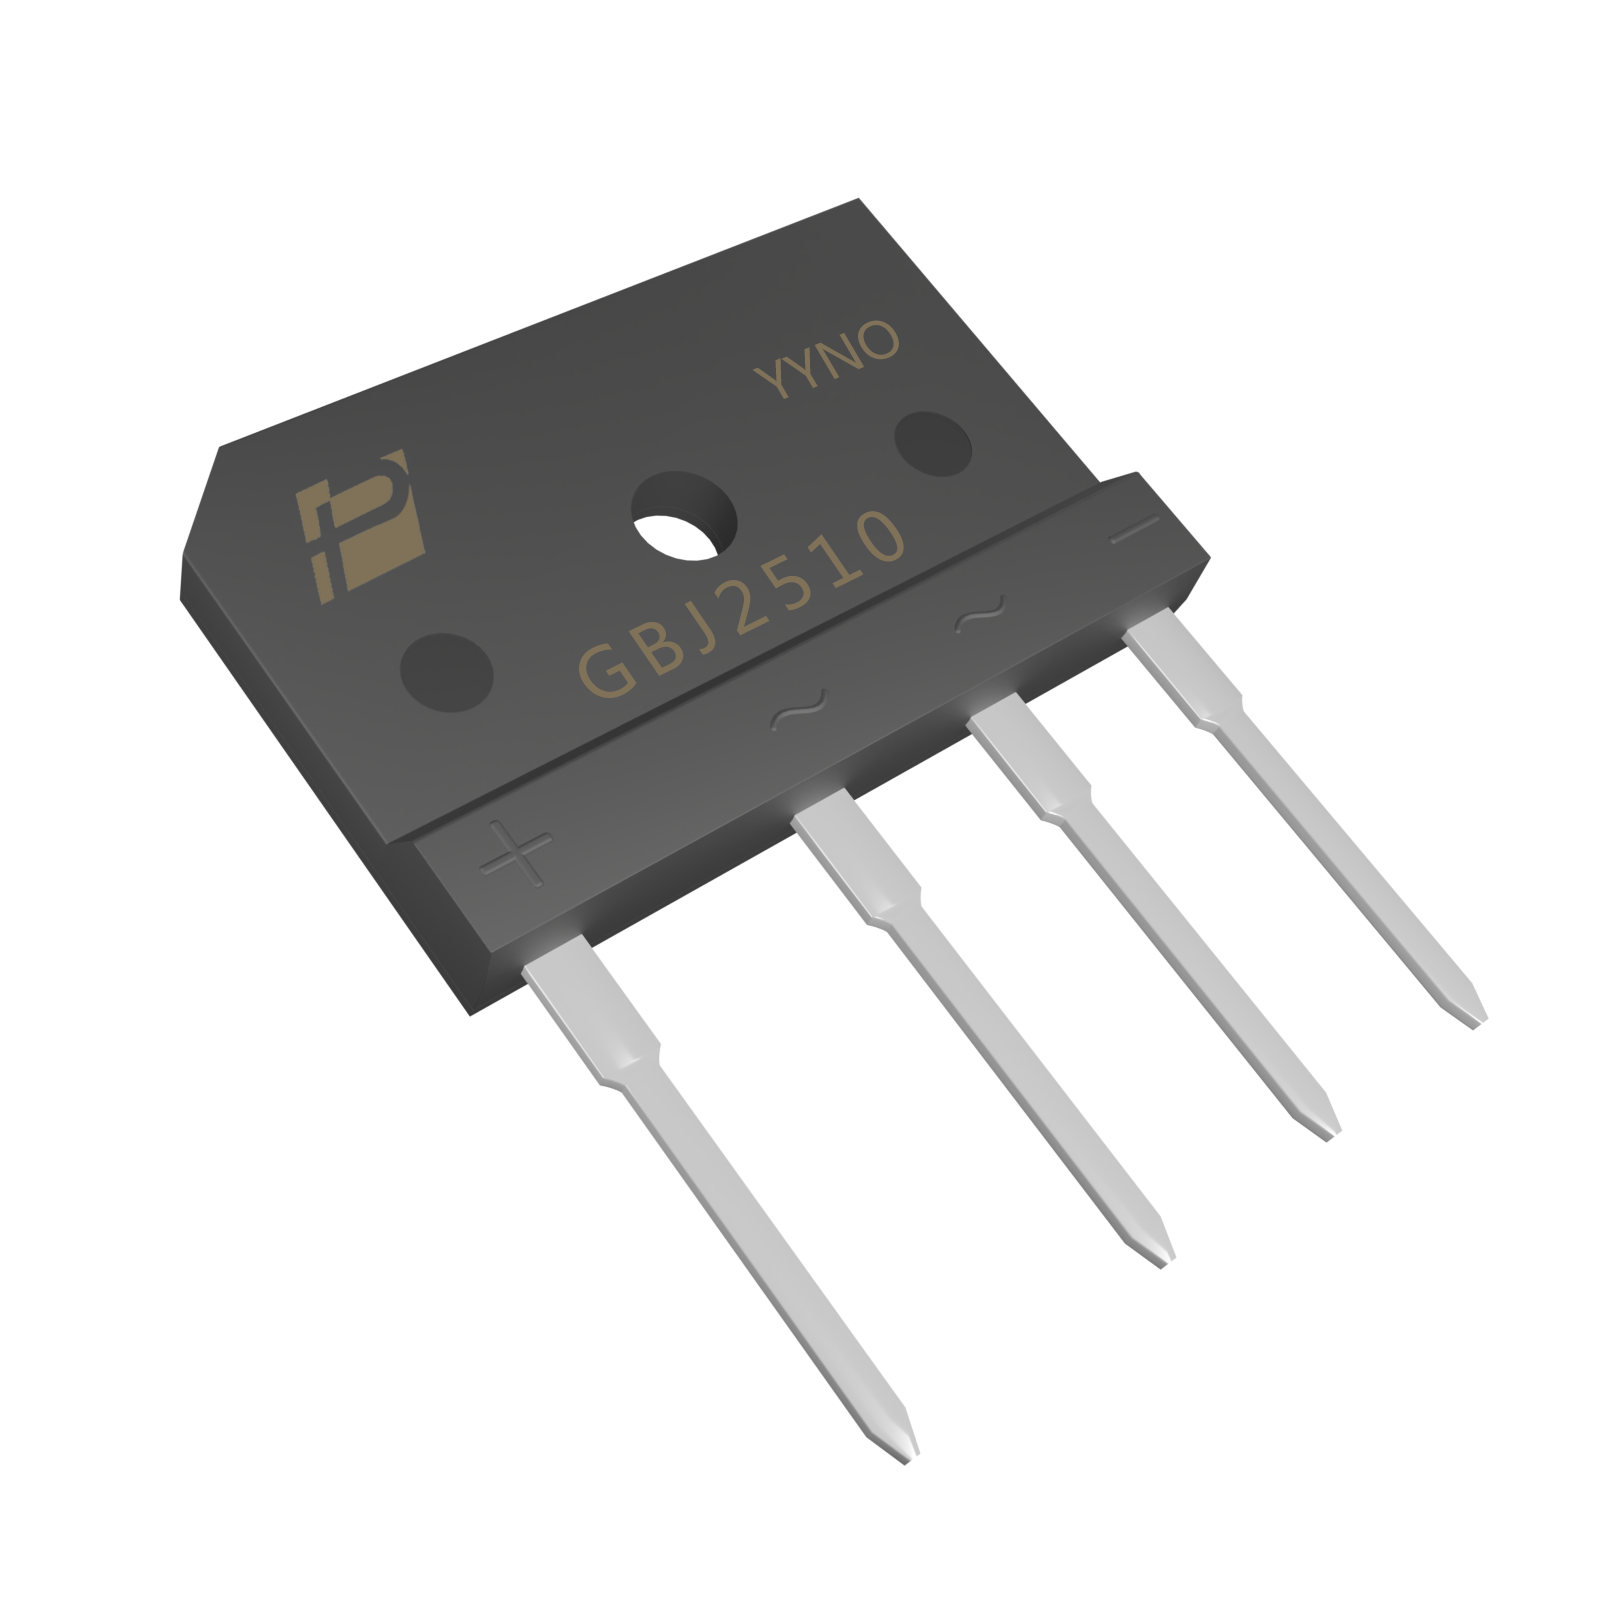
GBJ2510: its 25 A table entry specifies a heatsink and Tc = 110 degrees Celsius.
Match the Current Rating to the Cooling Arrangement
POWERSi’s GBJ2510 V2.0 table lists 25 A with a heatsink at a case temperature of 110°C. That stated condition is part of the rating. It is not a promise of 25 A on any PCB or at any ambient temperature.
Estimate dissipation, establish the case temperature with the intended interface and heatsink, and assess junction temperature using a thermal model appropriate to the bridge. Keep per-diode and whole-package quantities consistent. Hot-enclosure testing is particularly useful when nearby components share the cooling path.
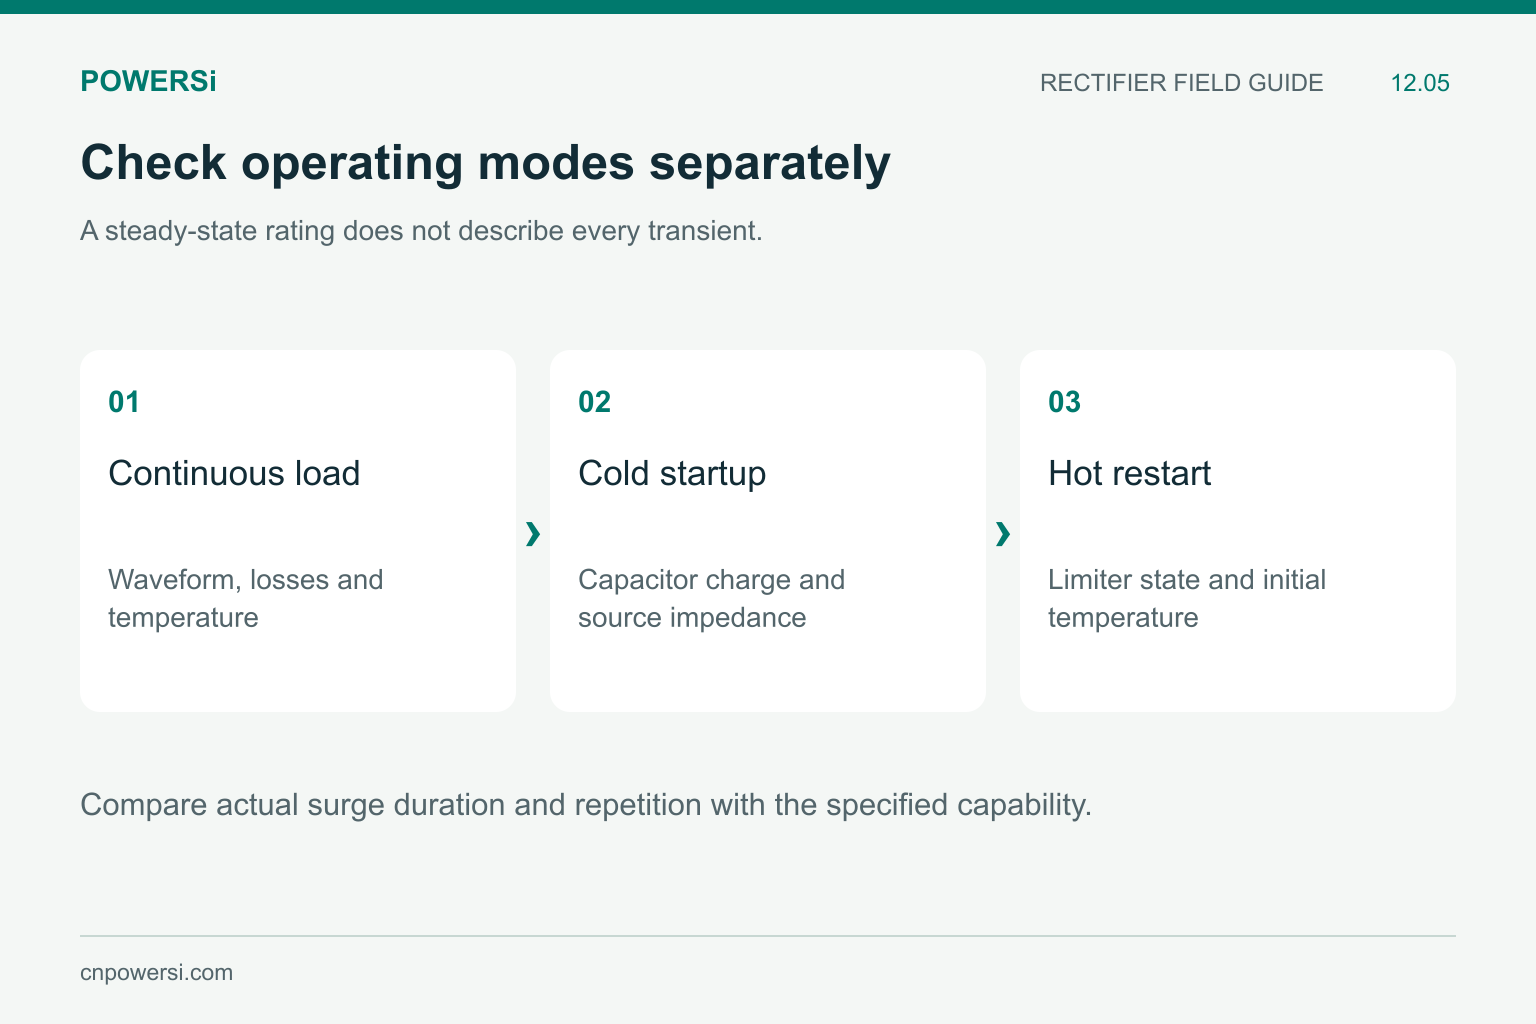
Surge capability requires its own operating conditions.
Check Startup and Restart Independently
Bulk-capacitor charging imposes a different stress from steady operation. Check initial capacitor voltage, source impedance, limiter behavior and hot restart. A non-repetitive surge rating describes a specified pulse and starting condition; it is not a continuous-current rating or permission for indefinitely repeated surges.
Give the supplier the input range, output power, efficiency assumptions, current waveform, cooling arrangement and startup profile. This makes a candidate comparison more useful than requesting a bridge for a wattage alone.
Key Takeaways
- Low-line operation often drives the input-current requirement.
- RMS input current and rated average bridge current are not interchangeable.
- Reverse voltage, heat and startup require separate checks.
- Validate the candidate under the actual waveform and mounting conditions.
Conclusion
Use output power to begin the calculation, then select the bridge from its measured electrical and thermal workload. Discuss a candidate from the POWERSi product range using the complete input and cooling conditions.
FAQs
Can I choose a bridge by output watts alone?
No. Input voltage, efficiency, power factor, waveform, startup and cooling can change the requirement for the same output power.
Why is low-line current higher?
Delivering the same real power at lower voltage requires more input current, with efficiency and power factor also affecting the result.
Does the calculated RMS current equal IF(AV)?
No. They describe different current measures. Relate the actual waveform to the rating definition and thermal conditions.
Does a larger current rating solve overheating?
Not necessarily. Junction losses, mounting, interface resistance and enclosure temperature still determine the thermal result.
Can IFSM replace an inrush assessment?
No. Compare the actual surge with the specified waveform, duration, repetition and temperature conditions.