Skip to content

Last Updated: November 5, 2026
Key Engineering Takeaways
- Compare reverse-recovery charge, peak current and waveform at matched test conditions.
- A shorter specified recovery time alone does not determine converter switching loss.
- Measure switch energy and temperature in the actual commutation loop.
Quick answer: An ultrafast PN diode must remove stored charge when its current reverses. During that interval, the opposing switch carries additional current and the diode may dissipate energy. A shorter data-sheet recovery time can help, but charge, peak current, waveform shape and test conditions matter too. Measure the complete circuit before declaring one part more efficient.
Why recovery matters in a converter
Consider a hard-switched boost power-factor-correction (PFC) stage. When the main switch turns off, inductor current flows through the boost diode to the DC bus. At the next turn-on, current transfers back to the switch. A PN rectifier does not immediately block: it first draws reverse current while stored charge is removed. The switch may briefly carry both inductor current and recovery current while supporting substantial voltage. That overlap increases turn-on energy, and rapid current changes can excite parasitic inductance and capacitance.
The same data-sheet number can produce different results in another topology. A resonant converter, a discontinuous-current stage or a low-frequency mains bridge may commutate differently. Start with the real current path and switching conditions, not a generic claim about the word “ultrafast.” Infineon’s CCM boost PFC design guide describes the influence of boost-diode recovery on system behavior.
Read the specifications as a group
| Parameter | What it describes | What to check |
|---|---|---|
| trr | Recovery time under a defined test method | Forward current, reverse bias, current slope, junction temperature and end-point definition |
| Qrr | Reverse recovery charge integrated over the specified interval | Compare the same conditions; charge influences current and energy in the commutation loop |
| IRRM | Peak reverse recovery current | Check switch current stress and measurement bandwidth |
| Recovery shape | How reverse current decays after its peak | Assess ringing and voltage overshoot in the assembled circuit |
| VF and thermal resistance | Conduction drop and heat path | Compare at relevant current and temperature, not only at room temperature |
For example, a simplified estimate of switching power is frequency multiplied by measured energy per switching event: P = f × E. If a scope measurement gives an additional 8 µJ per event at 50 kHz, the corresponding illustrative loss is 0.4 W. This is an arithmetic example, not a specification or prediction for any product. Energy must be measured or calculated for the actual device and operating conditions; simply multiplying bus voltage by a published Qrr is not a complete converter loss model.
Compare the device at operating temperature
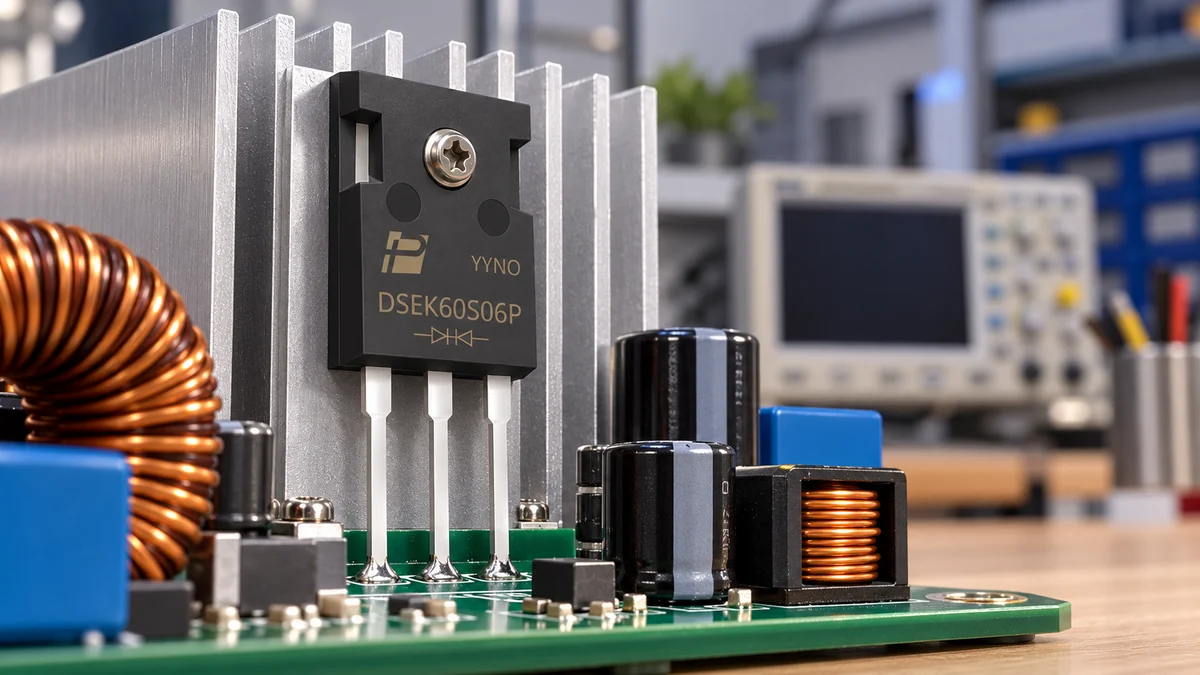
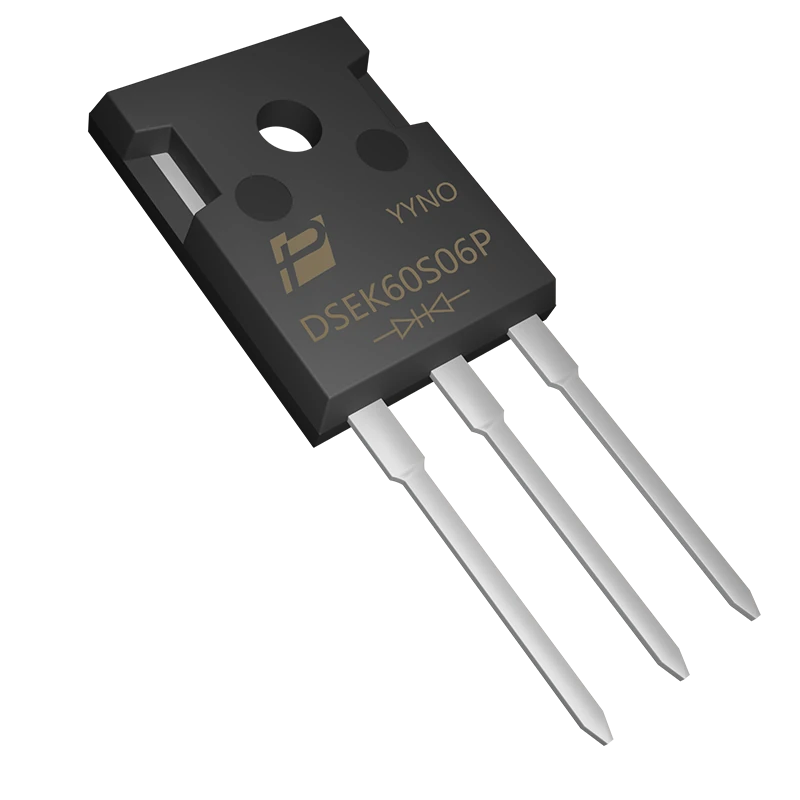
The POWERSi DSEK60S06P product page identifies a 600 V ultrafast soft-recovery rectifier in TO-247AD, with two 30 A common-cathode diode paths and a 60 A total device rating. Evaluate each branch and its actual current waveform separately. These headings are a starting point, not permission to run continuously at those numbers in every mounting arrangement. The product page and its linked PDF list different reverse-recovery, forward-voltage and thermal-resistance figures; their surge-current fields also differ or have incompletely matched conditions. Obtain a controlled datasheet and written clarification, check the exact definitions and recovery test conditions, and confirm safe current for the intended case temperature and cooling.
If the branches are paralleled, check current sharing and combined package heating rather than assuming equal current. The exposed tab is connected to the common cathode; if the heatsink must be at another potential, use a suitable insulating interface and include its electrical clearance, creepage and thermal resistance in the design.
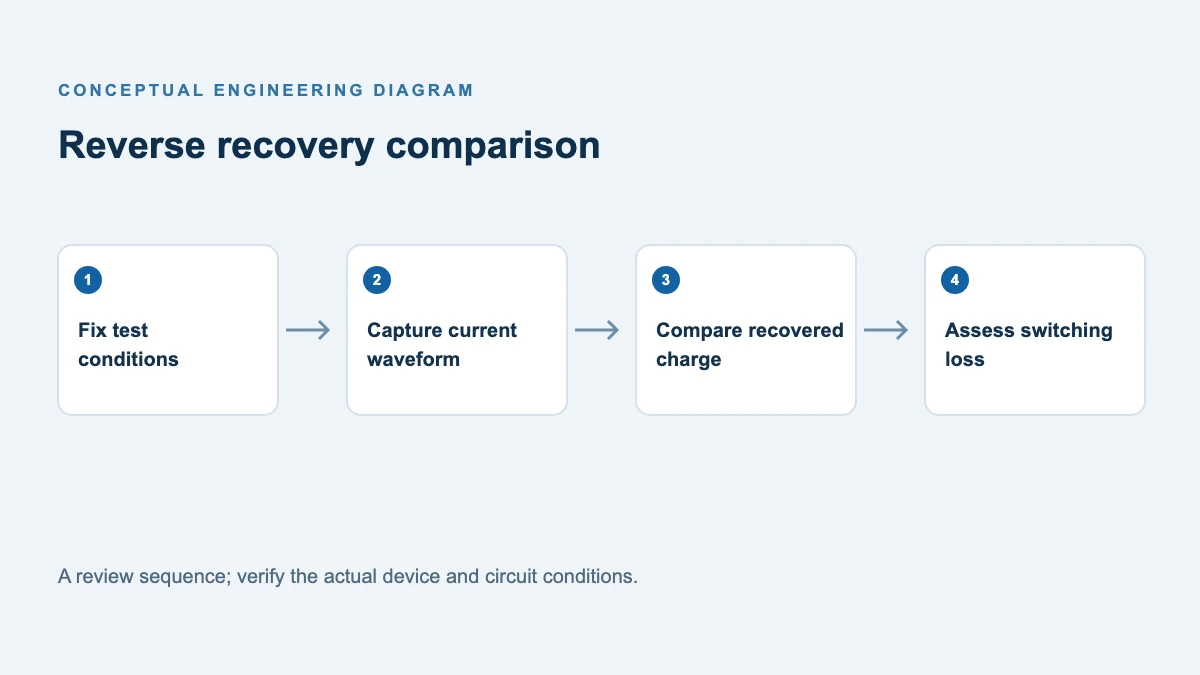
When comparing candidates, gather their recovery curves or test results at comparable forward current, di/dt, reverse voltage and junction temperature. A 30 ns result under one test condition cannot fairly be ranked against a 40 ns result under another. Do not infer peak recovery current or Qrr from trr alone; waveform geometry and conditions matter.
A repeatable recovery test record
Use the following blank record for each candidate and each operating point. Record the endpoint definition and integrate the negative-current portion only over the same declared interval; oscilloscope offsets, bandwidth and current-probe zero can materially affect the result. A double-pulse fixture and the actual converter can yield different results: record which one was used, and never compare them as if they were identical.
| Record field | Candidate A | Candidate B |
|---|---|---|
| Manufacturer, exact part and datasheet revision | ____ | ____ |
| Forward current immediately before commutation | ____ A | ____ A |
| Reverse voltage and current fall rate | ____ V; ____ A/µs | ____ V; ____ A/µs |
| Initial junction-temperature estimate and method | ____ °C; ____ | ____ °C; ____ |
| Probe type, deskew and bandwidth | ____ | ____ |
| Integration and trr endpoint definitions | ____ | ____ |
| Measured Qrr, peak reverse current and trr | ____ nC; ____ A; ____ ns | ____ nC; ____ A; ____ ns |
| Switch turn-on energy, ringing and temperature | ____ | ____ |
The earlier Fast vs Ultrafast Recovery Rectifiers article explains selection beyond trr. This worksheet adds a matched-condition measurement record and a repeatable method for comparison.
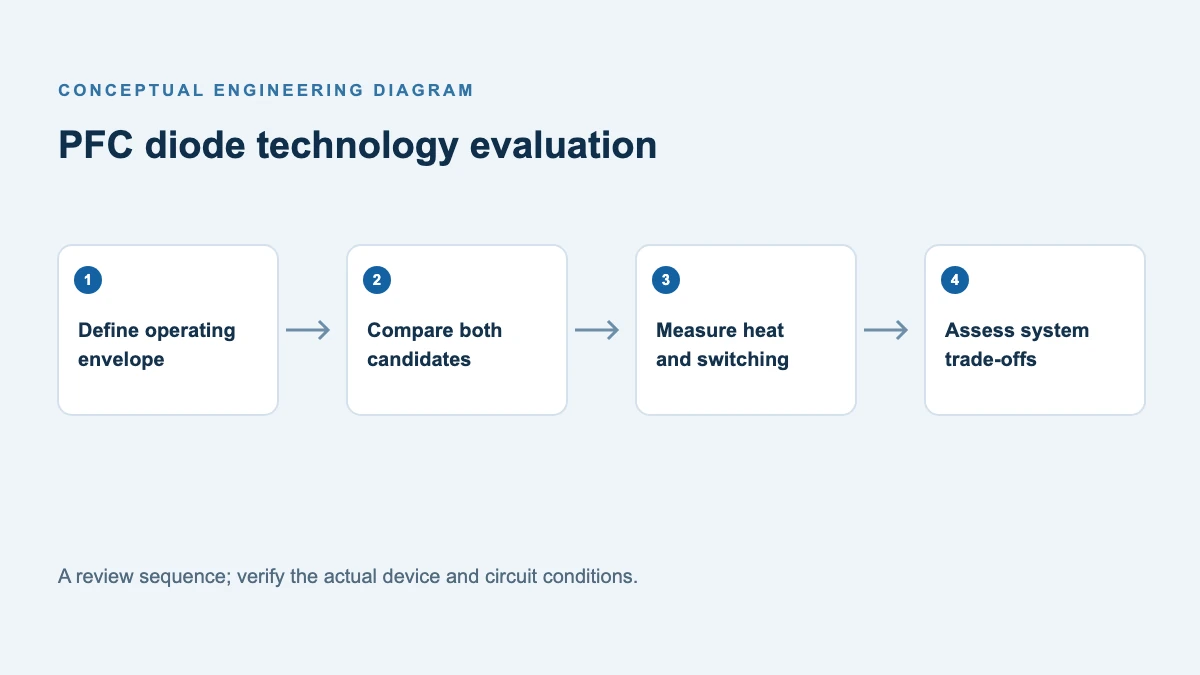
A practical evaluation sequence
- Identify the worst commutation point across line, load and temperature, including startup and overload.
- Screen reverse-voltage stress, repetitive current, surge rating, thermal resistance, package and pinout.
- Compare recovery data at matched conditions. Ask for missing information rather than inventing it.
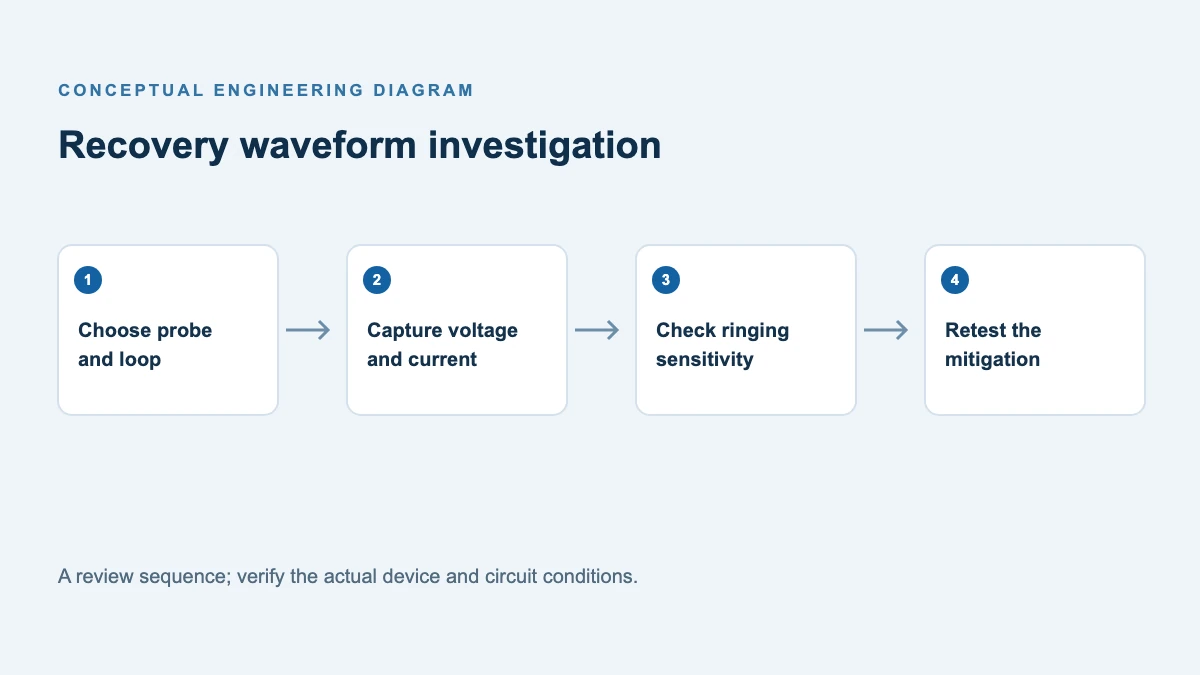
- On an appropriately protected bench, use suitable differential and current probes with short loops. Observe diode current, switch voltage and current, and diode reverse voltage together.
- Integrate switch voltage and current around turn-on consistently for each candidate; compare full-cycle input/output power and component temperatures after thermal stabilization.
- Check conducted and radiated emissions on the final layout. Changing gate resistance or snubber settings may be necessary, so record both the unchanged-settings test and any optimized result.
A faster device can still lose a system comparison if its forward loss is higher, its package has a worse thermal path, or the new waveform requires different damping. Ensure the comparison includes the switch, diode, snubber and cooling system.
Support for your evaluation
For a design review of DSEK60S06P, share the topology, commutation waveforms, voltage and current limits, case temperature and cooling arrangement with POWERSi. Review the DSEK60S06P ultrafast rectifier details and request its controlled data sheet.
FAQs
Does a shorter trr always mean lower switching loss?
No. The specified current slope, temperature and reverse voltage influence recovery; reverse charge and waveform shape are also significant. Compare measured event energy under the same conditions.
Is recovery loss confined to the diode?
No. The commutating switch may carry reverse-recovery current while voltage is present and can incur substantial additional turn-on loss.
Can an ultrafast diode replace a standard input bridge?
Only after checking voltage, current waveform, surge, package, pinout and thermal requirements. High-frequency recovery performance is not automatically the governing requirement at line frequency.
What should I send to a supplier?
Provide topology, switching frequency, maximum diode reverse voltage including overshoot, forward current waveform, ambient/case temperatures, available cooling, package constraints and the test conditions used for comparison.