Skip to content

Last Updated: November 5, 2026
Key Engineering Takeaways
- Estimate flyback diode reverse stress from output voltage and reflected input, then include measured overshoot.
- Compare Schottky and fast-recovery candidates at common circuit and temperature conditions.
- Different device voltage and current classes prevent assuming direct interchangeability.
Quick answer
A silicon Schottky diode can be a useful flyback secondary rectifier where the actual reverse-voltage peak and current fit its ratings and its forward and hot-leakage losses are acceptable. A fast-recovery silicon diode may offer a higher voltage class, but its reverse-recovery behavior must be checked at the circuit’s actual commutation conditions. Estimate voltage stress before comparing parts, then measure diode waveforms, losses and temperature in the real converter.
This guide concentrates on a single-ended flyback secondary and a repeatable comparison. The broader relationship between rectifier choice and circuit position is discussed in POWERSi’s switching-supply topology overview.
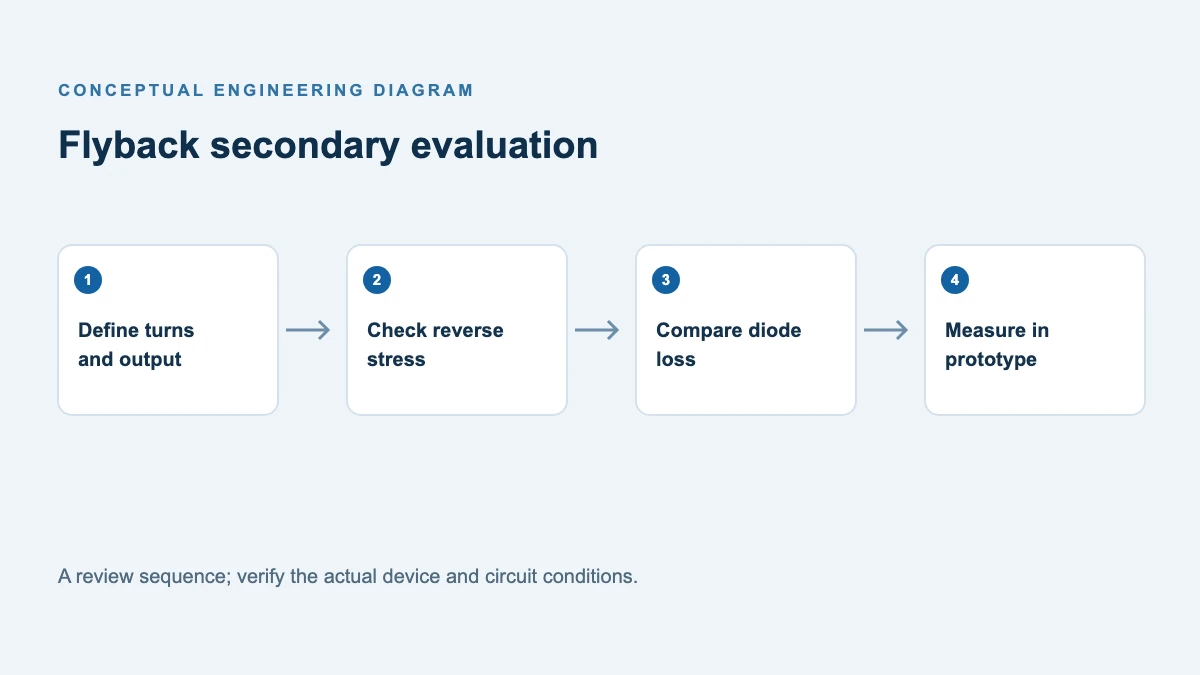
Start with the secondary blocking voltage
In an ideal single-output flyback, the output diode blocks when the primary switch is on. Its approximate reverse voltage is:
Vᵣ,ideal ≈ Vout + Vin × Ns/Np
Here Vin is primary DC input voltage, Vout is the output voltage, and Ns/Np is the secondary-to-primary turns ratio. This is an ideal first estimate; it does not include leakage-inductance ringing, layout parasitics or tolerance. TI’s flyback reference design applies the same output-plus-reflected-input calculation to its secondary diodes.
For a teaching example, let the maximum input be 100 V, output 24 V and Ns/Np = 0.5. The ideal reverse stress is 24 + 100 × 0.5 = 74 V. Suppose the measured worst-case overshoot adds 26 V: the resulting observed peak is 100 V. Both values are hypothetical, not ratings or test results for a POWERSi product. Apply the project’s own voltage-derating policy to the measured worst case; 100 V peak alone does not establish that any particular voltage rating is adequate.
A higher input limit, different turns ratio, startup overshoot or an inadequate snubber could change the result. Verify at minimum and maximum input, relevant load levels, startup, shutdown and transients. Use an appropriately rated differential or isolated probing arrangement with a short measurement loop. Probe capacitance and grounding can change the waveform; do not attach an earth-referenced ground clip to a floating high-voltage node.
Compare real candidates by role, not by voltage alone
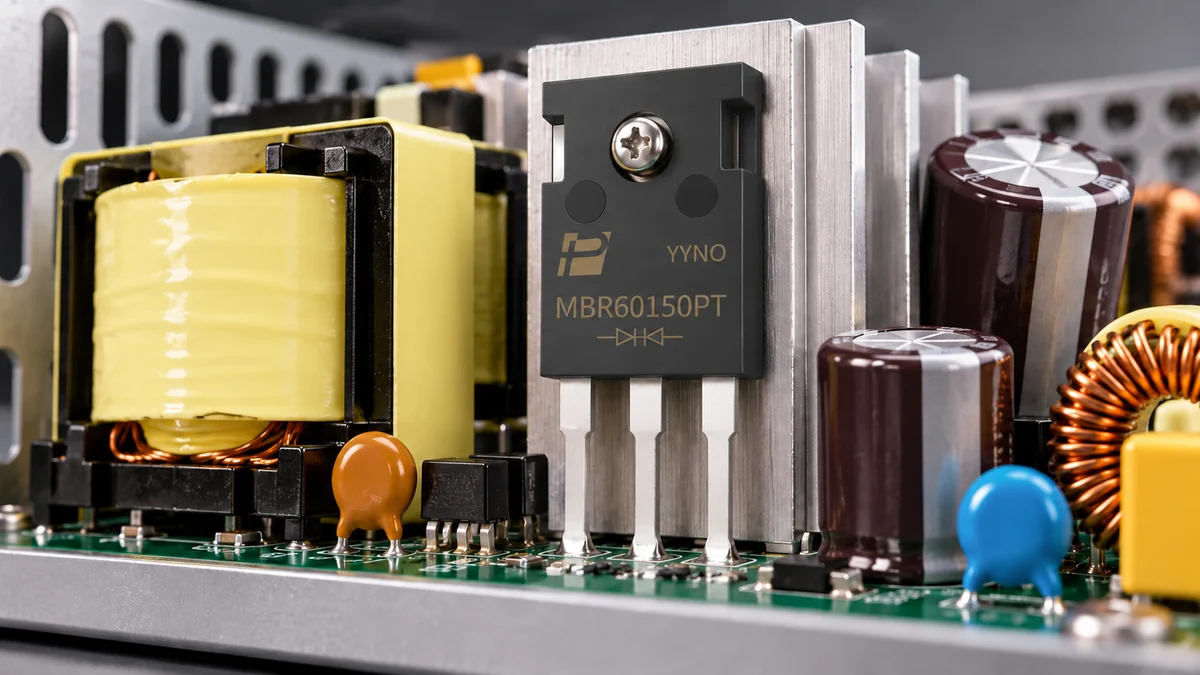
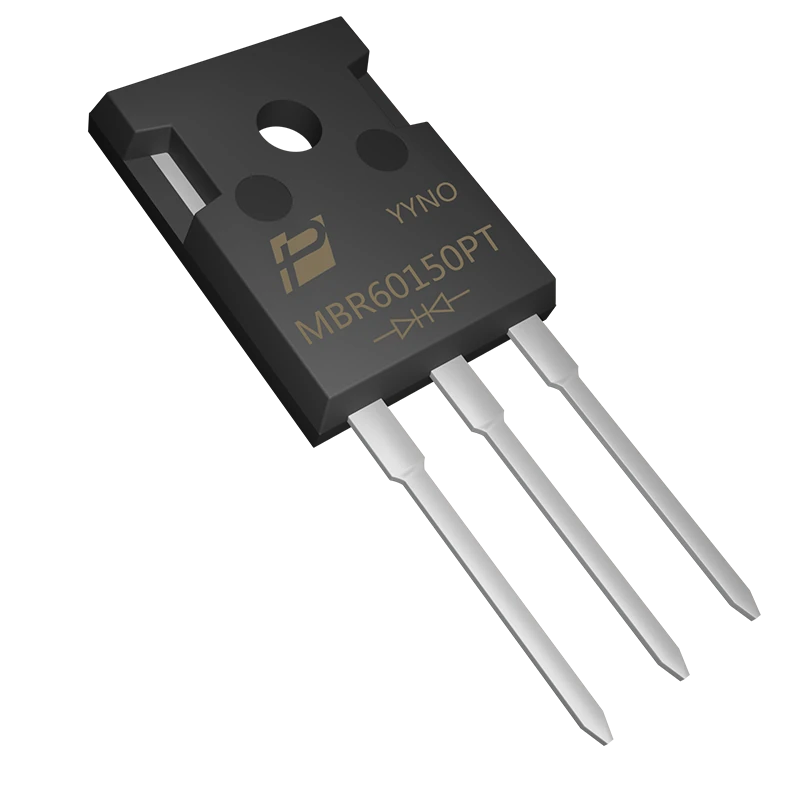
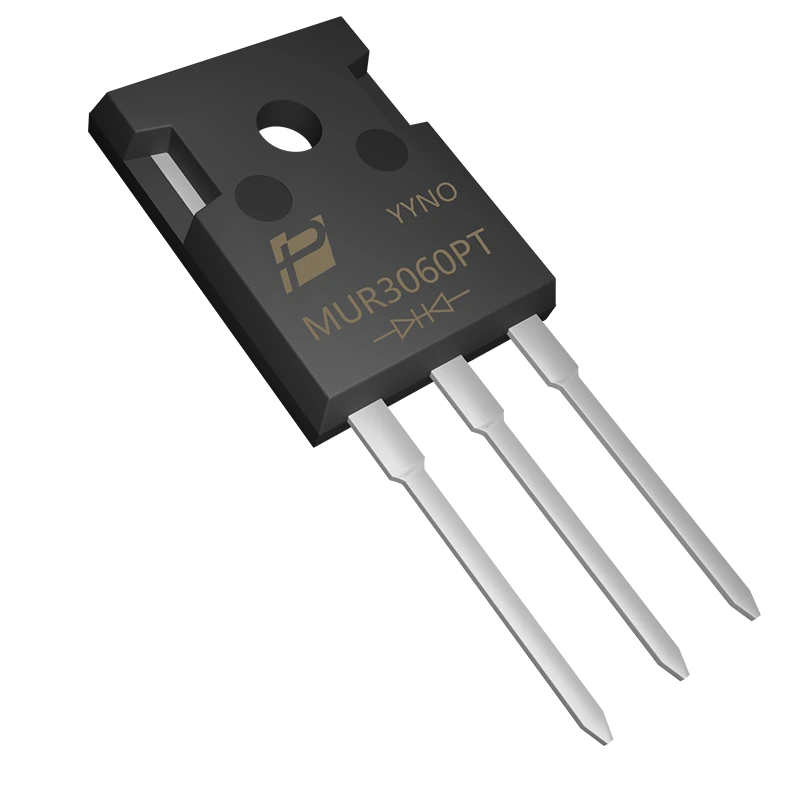
The POWERSi MBR60150PT is a 150 V silicon Schottky device, with two 30 A paths and a 60 A total device rating. The POWERSi MUR3060PT is a 600 V fast-recovery device with two 15 A paths and a 30 A total device rating. Both are listed as common-cathode dual diodes in TO-247AD. Those differences make them examples for technology evaluation, not drop-in equivalents.
A circuit using one branch must satisfy the per-branch limits; the package total does not apply to a single path. If both anodes are paralleled for one output, do not assume equal current sharing or that the total package rating is available under every waveform and cooling condition. Evaluate each branch, current sharing, total package heating and any required derating against the controlled data sheet and application measurements. Other secondary arrangements can use the branches differently; verify the actual topology. Match connection and tab potential, peak and average current, reverse stress, thermal mounting and any product qualification requirements before trying a replacement. The two parts’ different voltage and current classes also mean a measured efficiency difference cannot be attributed to technology alone.
| Comparison item | Silicon Schottky candidate | Fast-recovery silicon candidate |
|---|---|---|
| Forward conduction | Often attractive for lower-voltage outputs; read the VF curve at actual pulse current and temperature. | Compare its own curve at matching current and temperature; do not compare a typical value with another device’s maximum. |
| Blocking | Check voltage peak, margin and leakage at hot junction temperature. | Check the selected voltage class and leakage under the same circuit conditions. |
| Commutation | No conventional minority-carrier recovery, but junction capacitance and circuit parasitics still cause current and loss. | Stored charge produces recovery current; compare charge and waveform at application conditions. |
| Thermal result | Account for conduction, leakage and switching-related loss. | Account for conduction, recovery-related energy and the rest of the system’s losses. |
The MUR3060PT product page lists a 50 ns maximum recovery time at 25°C, IF = 0.5 A, IR = 1 A and Irr = 0.25 A. That number alone does not predict recovery at the converter’s actual forward current, di/dt and temperature. Recovery current and ringing also interact with the transformer, switch, snubber and layout.
Measure losses without overclaiming
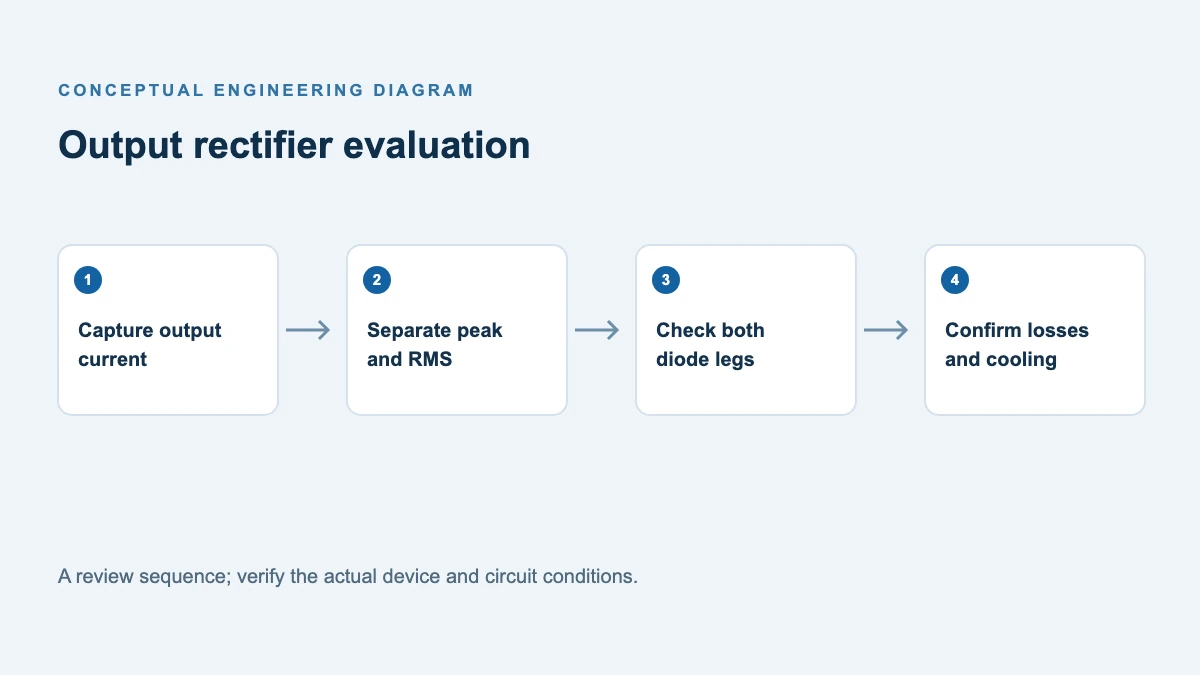
Use the same input, output, load, frequency or control mode, cooling and ambient conditions for both candidates. Allow thermal stabilization and log input and output power over the load range. The difference in total converter loss is (Pin − Pout) for candidate A minus (Pin − Pout) for candidate B. It includes any change in switch, snubber and magnetic losses; it is not automatically the diode’s loss alone.
Record diode voltage and current together using suitable synchronized, compensated probes. Using a consistent passive sign convention, integrate instantaneous diode terminal voltage × current over one full representative cycle to estimate net terminal energy E. Divide E by the period T, or multiply E by switching frequency, to estimate average terminal power; do not multiply cycle-averaged power by frequency. This method includes energy returned during capacitive intervals and requires a full-cycle capture. Check probe polarity, bandwidth, time alignment and offsets, especially where voltage and current cross zero; parasitic fixture losses and probe loading can also affect the result. Measurement uncertainty can be larger than the difference between candidates. Compare common-case temperatures at identical mounting and airflow.
For discontinuous conduction, the diode current can fall to zero before the next primary turn-on; recovery behavior and loss may differ from continuous-conduction operation. TI’s DCM flyback explanation illustrates the relevant intervals. Repeat tests at the actual mode boundaries rather than assuming one waveform applies throughout the load range.
Keep the A/B test electrically comparable
Start with a baseline converter that meets its functional requirements. Record the circuit revision, transformer and snubber values, board layout, diode mounting, input source, load and control settings. Change only the diode for the first comparison if the devices can safely fit the same electrical and mechanical arrangement. If one candidate requires a different pinout, insulation, snubber or heatsink, document that as a separate design change and repeat the baseline where practicable. The parts discussed here have different voltage and per-branch current classes, so the same fixture is appropriate only after each candidate independently passes those checks.
Capture reverse voltage directly across the active diode and forward or reverse current in its branch. Save the full switching cycle at high line and at low line, then repeat at the relevant light- and full-load points. Note whether the converter is in discontinuous, boundary or continuous conduction and whether it changes switching frequency or enters burst operation. A single waveform may represent neither the lowest efficiency point nor the highest voltage peak. Also record startup and load-step peaks separately; a brief transient is not a substitute for the repetitive steady-state measurement.
| Test record | Candidate A / candidate B |
|---|---|
| Device and controlled revision | Exact order code, pinout, mounting and source |
| Operating point | Input, output, temperature, frequency and conduction mode |
| Voltage and current | Peak reverse voltage, branch-current waveform, measured ringing and probe settings |
| System outcome | Input/output power, stabilized case temperature, uncertainty and thermal conditions |
| Disposition | Limits passed, unresolved discrepancies and changes needed before release |
When comparing power-analyzer readings, record calibration and stated uncertainty at the actual power factor and power range. If the difference between candidates is smaller than the combined measurement uncertainty, report it as inconclusive and improve the setup or use a larger sample. Terminal waveform integration is also sensitive to probe delay and offset; correct and document those errors before interpreting the small difference between two large signals. Compare an unchanged heatsink and enclosure first, then assess any proposed cooling redesign as a separate system-level experiment. The resulting record supports a decision on voltage margin, temperature and efficiency without implying a measured result where no test has been performed.
Support for your evaluation
Review the MBR60150PT Schottky rectifier and MUR3060PT fast-recovery rectifier details as separate candidates. Share the schematic position, input and output range, diode voltage and current waveforms, thermal arrangement and desired acceptance limits when contacting POWERSi.
FAQs
Does a Schottky diode have zero switching loss?
No. Its junction capacitance and surrounding parasitics still participate in switching and dissipative circuit processes.
Does a faster data-sheet recovery time always mean a cooler converter?
No. Test conditions, forward loss, recovery charge, ringing, snubber loss and the operating waveform all matter.
Can MBR60150PT directly replace MUR3060PT?
Their voltage and per-branch current ratings differ. Evaluate the exact circuit and thermal requirements; the two are not presented as interchangeable.
Is Vout the maximum reverse voltage of the output diode?
Generally not for a flyback. The output voltage and reflected input contribute, and transient overshoot can add further stress.
References
- POWERSi MBR60150PT linked data sheet — reconcile the public documents and obtain the controlled revision for the order code.
- POWERSi MBR60150PT product page — silicon Schottky example.
- POWERSi MUR3060PT product page — fast-recovery example and test conditions.
- POWERSi MUR3060PT linked data sheet — check controlled revision and reconcile figures with the product page.
- Texas Instruments, Automotive 40-V to 1-kV Input Flyback Reference Design — secondary rectifier voltage-stress calculation.
- Texas Instruments, DCM Flyback Converter Operation — current intervals and operating-mode context.