Skip to content
Diode Batch Consistency: What Yield Data Can and Cannot Prove
Last Updated: 2026-10-08
Quick Answer
Diode batch consistency cannot be established by one yield percentage without its definition, test conditions and production scope. Separate first-pass yield, final accepted yield and field-return data. Compare parameter distributions and failure categories across traceable lots, then relate those findings to the application’s requirements rather than assuming a high factory yield guarantees reliability.
“Our yield exceeds 99%” can describe several different measurements. It may count wafer die, assembled devices or units accepted after additional processing. Before comparing suppliers, make sure the numerator, denominator and acceptance rules refer to the same stage and population.
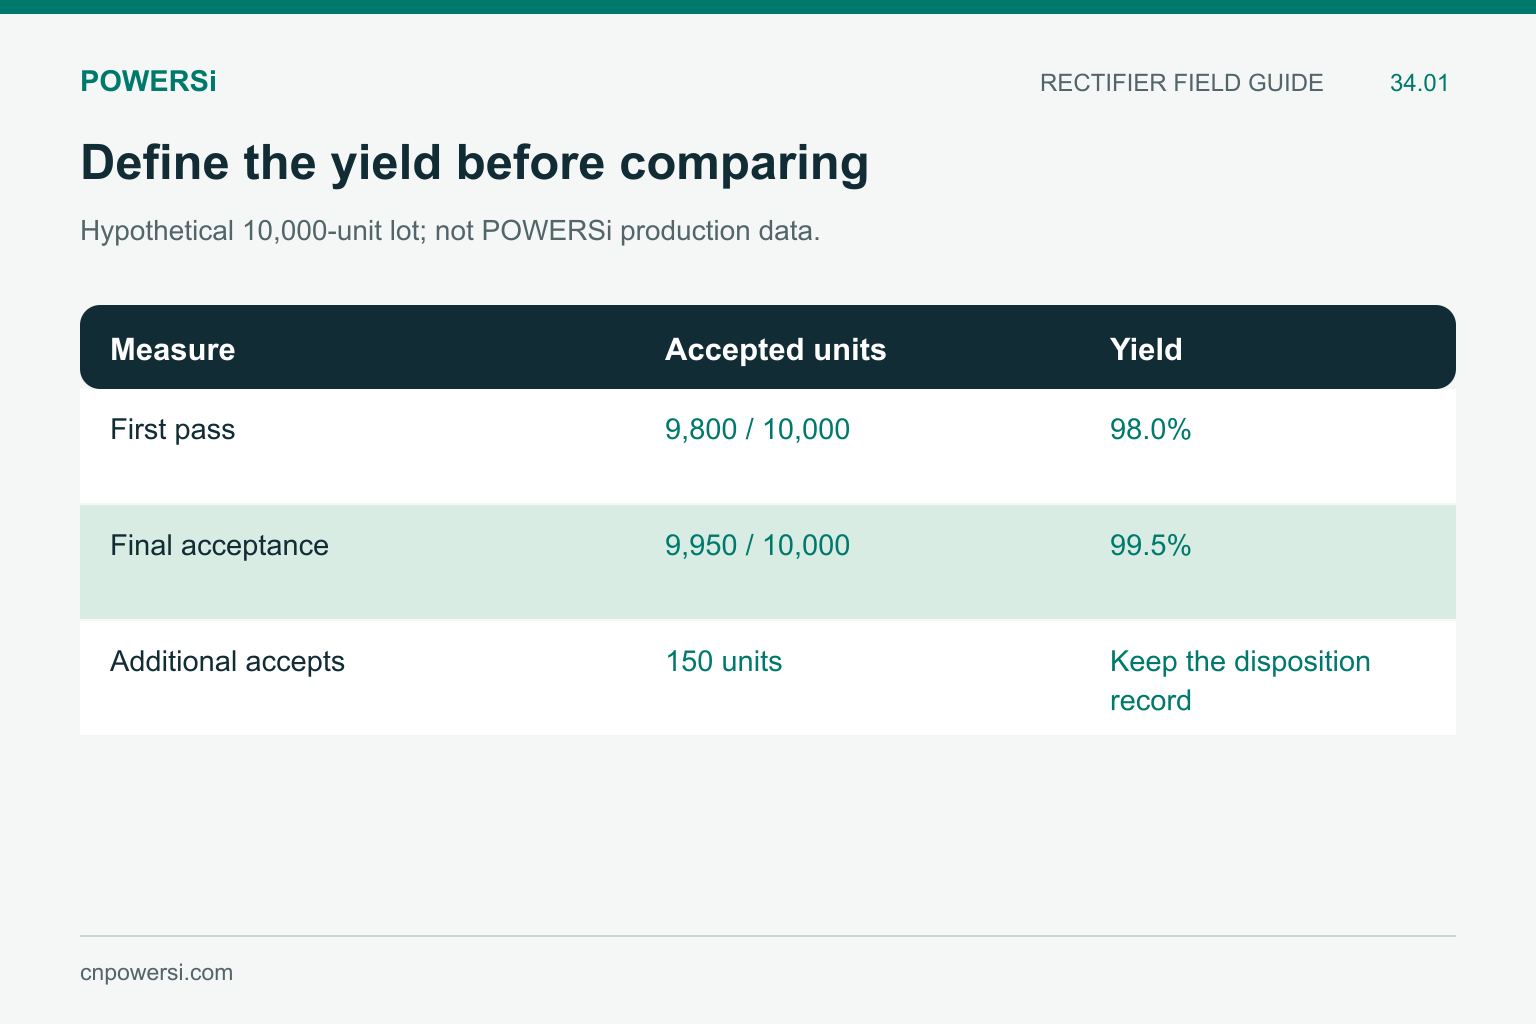
Hypothetical 10,000-unit lot; not POWERSi production data.
Ask Which Yield Is Being Reported
First-pass yield counts units accepted at the first defined pass through an operation. Final yield counts accepted units after the permitted disposition steps. The difference can be informative, but only if retest, rework and exclusion rules are disclosed and controlled.
A hypothetical lot of 10,000 units might have 9,800 first-pass accepts and 9,950 final accepts after an allowed additional process. Its first-pass yield is 98.0%, while final yield is 99.5%. The 150 additional accepts should remain visible in the record. These are teaching numbers, not POWERSi production results or an industry benchmark.
Neither percentage says which parameter caused rejection or whether the limits are appropriate. A high yield under a loose screen is not directly comparable with a lower yield under tighter conditions.
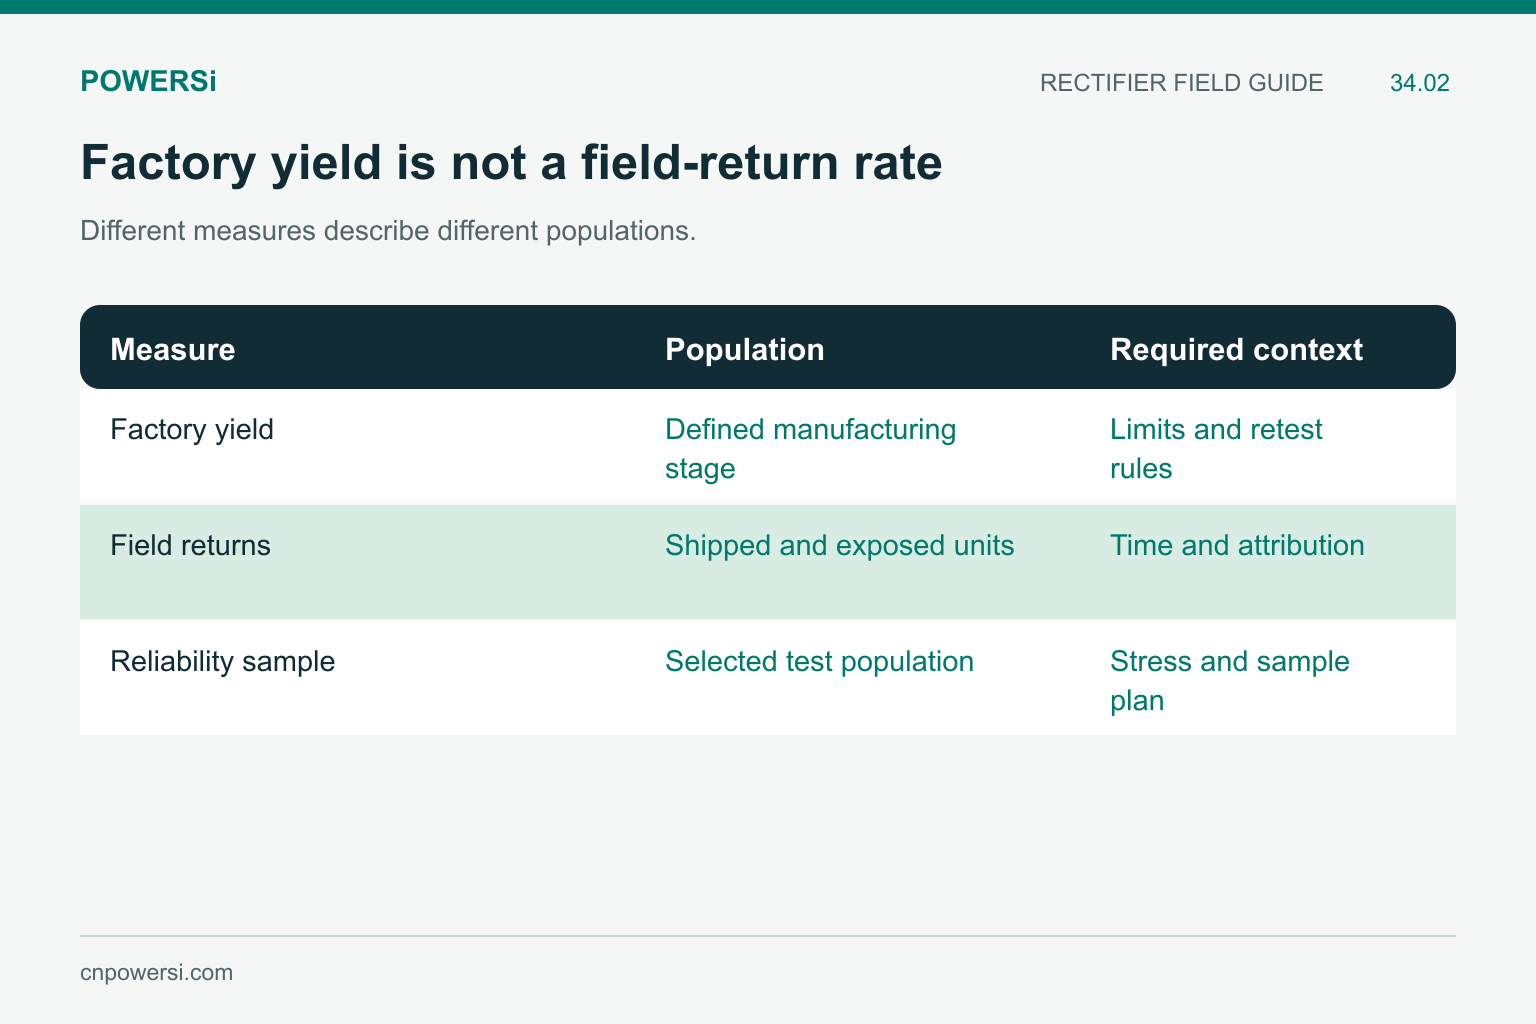
Different measures describe different populations.
Separate Factory Yield From Field Performance
Factory yield describes a defined manufacturing population and inspection point. Field returns involve shipped products, operating conditions, reporting delays and attribution. They use different denominators and cannot be exchanged as if they were the same reliability measure.
For a return-rate discussion, define shipment period, units exposed, observation interval and whether failures were confirmed as component-related. A no-return statement without exposure time is incomplete. Similarly, zero failures in a finite sample does not establish zero risk in all future units.
Use reliability evidence that matches the relevant failure mechanisms and mission profile. A factory acceptance result can be part of that evidence chain, but it does not replace it.
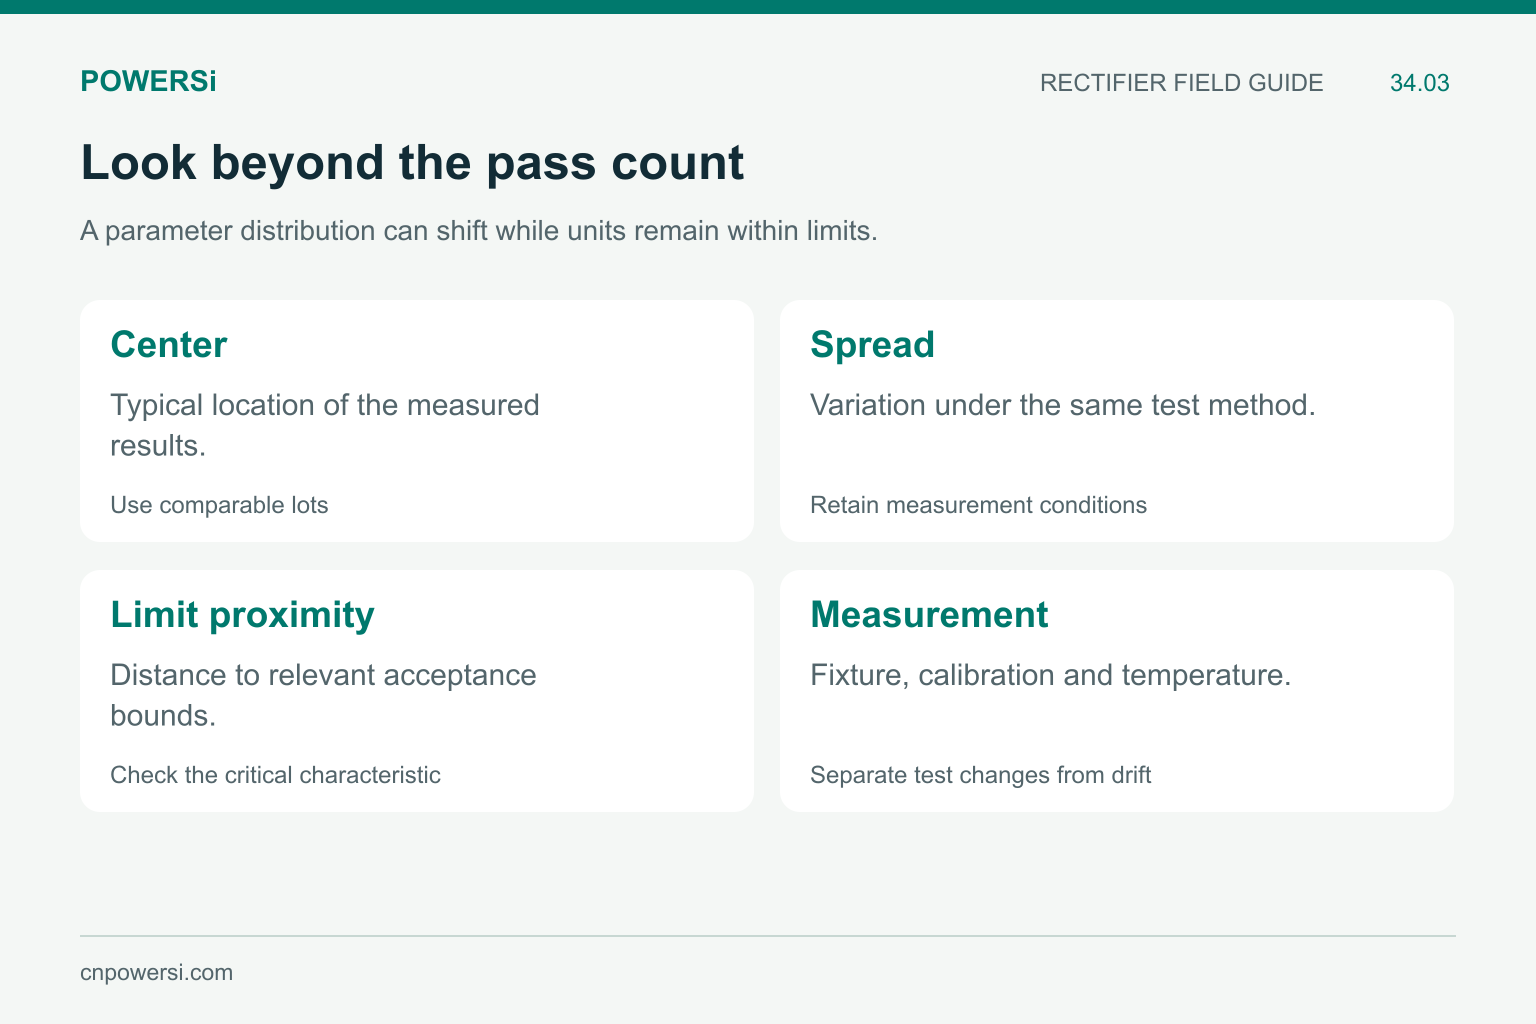
A parameter distribution can shift while units remain within limits.
Compare Parameter Distributions Across Lots
A pass/fail count can hide a shift within the permitted range. For important parameters such as forward voltage or hot leakage, compare measurements taken with consistent current, voltage, temperature and test methods. Examine central values, spread and proximity to the relevant limits.
Distinguish a real process change from a measurement-system change. Different fixtures, calibration, temperature stabilization or retest rules can move the apparent distribution. Do not combine results from different conditions into one trend line and then label the movement a manufacturing problem.
Where process-capability indices are supplied, retain their assumptions, specification limits and evidence of process stability. An impressive index without a stable, comparable measurement basis is not a substitute for the underlying data.
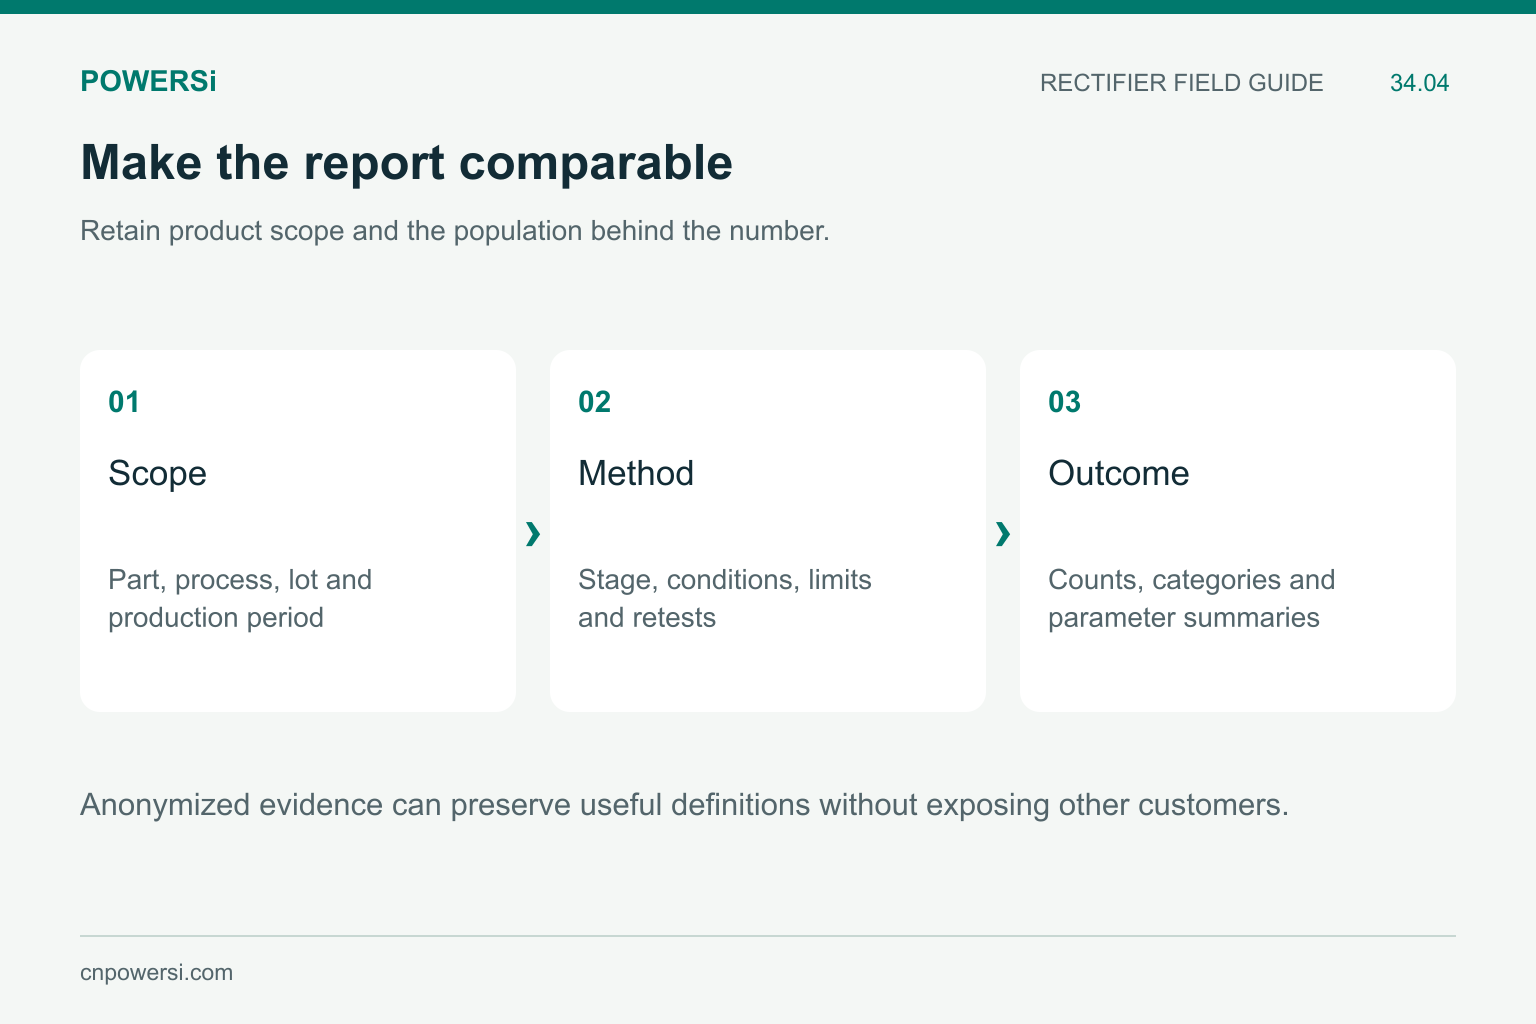
Anonymized evidence can preserve useful definitions without exposing other customers.
Request a Report That Can Be Compared
| Report field | Why it matters |
|---|---|
| Exact part and process scope | Prevents mixing unrelated constructions |
| Lot and production period | Defines the population and time window |
| Test stage and conditions | Makes the acceptance basis comparable |
| First-pass and final counts | Exposes retest or rework effects |
| Failure categories | Shows what actually caused rejection |
| Parameter summaries | Reveals shifts concealed by a pass rate |
Aggregated or appropriately anonymized data can answer many sourcing questions without disclosing proprietary process details. The key is that the scope and definitions remain clear. A supplier should not need to expose unrelated customer information to support a part-specific quality discussion.
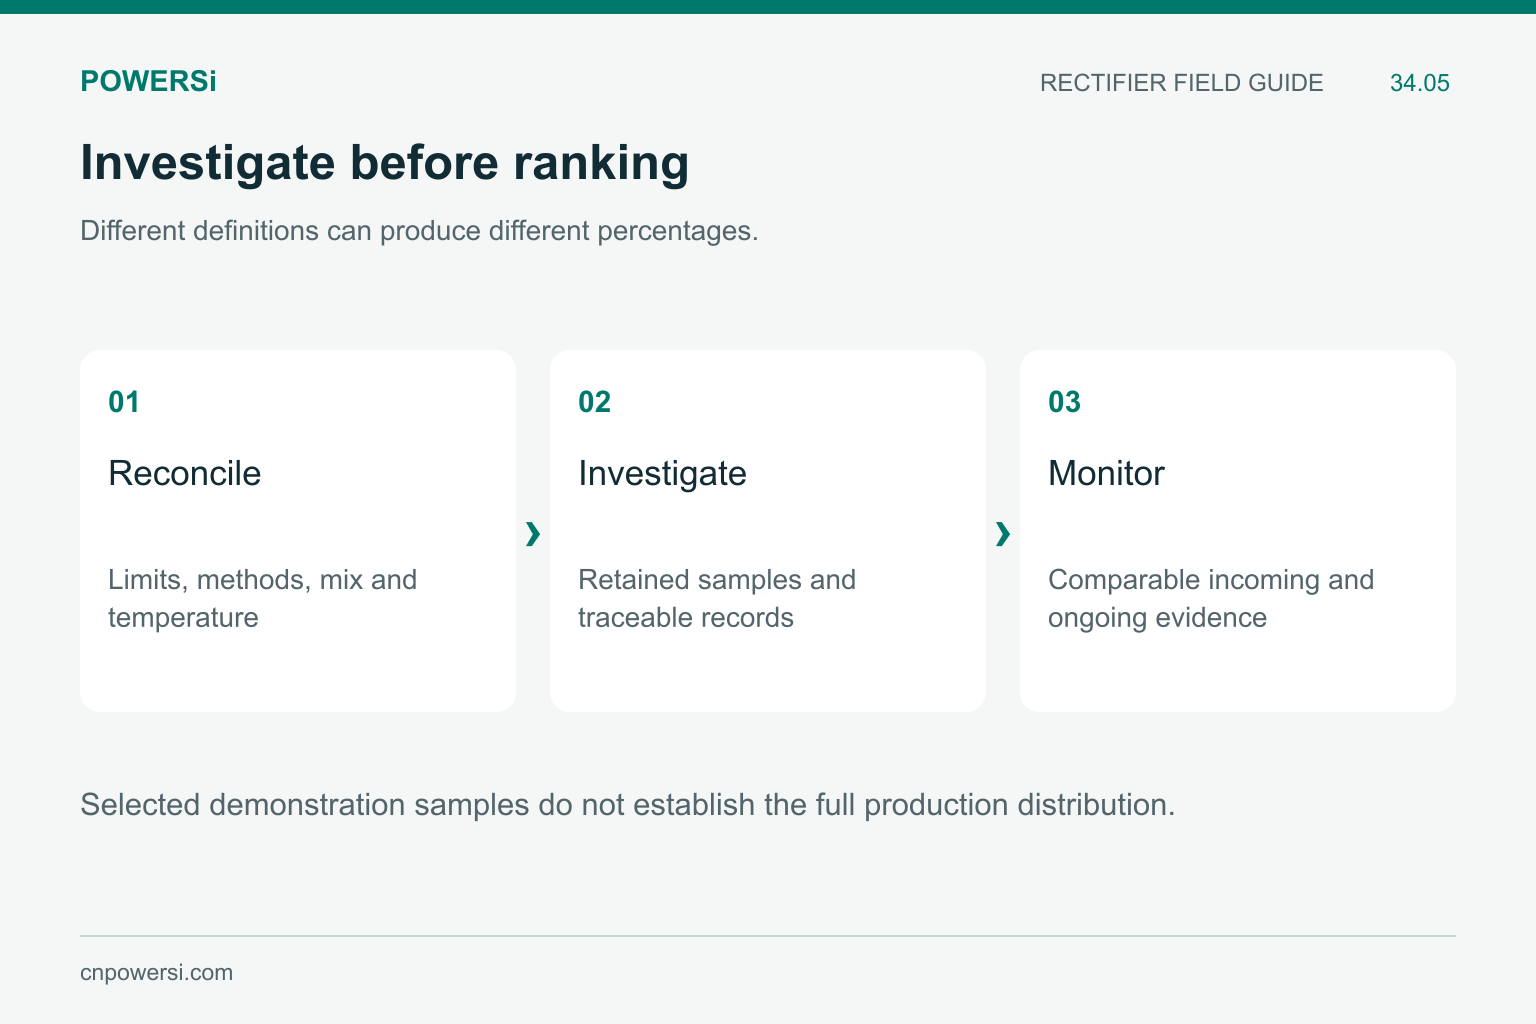
Selected demonstration samples do not establish the full production distribution.
Investigate a Difference Before Ranking Suppliers
If two reports disagree, first reconcile their definitions. Determine whether a new limit, product mix, test temperature or construction change explains the result. Then investigate any remaining shift using retained samples and traceable records.
Set an incoming assessment around the application’s critical characteristics. Keep sample selection and acceptance criteria consistent across suppliers. A small set of selected demonstration samples may show feasibility, but it cannot establish the entire production distribution or long-term lot consistency.
For ongoing supply, agree how meaningful changes or adverse trends will be communicated and investigated. This turns a one-time yield claim into a repeatable quality conversation.
Key Takeaways
- Define the yield stage, denominator and disposition rules.
- Keep factory yield separate from field-return and lifetime evidence.
- Look at comparable parameter distributions as well as pass rates.
- Investigate differences before turning them into supplier rankings.
Conclusion
The useful quality number is the one whose meaning can be checked. Ask POWERSi for the applicable product and lot evidence needed by your application, with a shared definition of the parameters and reporting scope.
FAQs
Is final yield the same as first-pass yield?
No. Final yield may include units accepted after permitted additional processing or retest.
Does 99.5% yield guarantee a low field-failure rate?
No. Manufacturing acceptance and field reliability describe different populations and conditions.
Can passing lots still show parameter drift?
Yes. Their distributions can move within specification limits even when every measured unit passes.
Does zero sample failures prove zero production risk?
No. A finite sample supports a limited statistical inference, not a universal guarantee.
What must remain consistent in a lot comparison?
Keep the product scope, test method, conditions, limits and treatment of retests comparable.