Skip to content
How to Read Diode V-I Curves: A Shared Language for Buyers and Engineers
Last Updated: 2026-10-06
Quick Answer
Read diode V-I curves by identifying the axis units, scale, polarity and temperature before selecting an operating point. A typical curve describes representative behavior, while a maximum table entry sets a limit under stated conditions. Keep current, temperature and value type together so that engineering and purchasing compare the same requirement.
“The diode drops 0.7 V” is incomplete information. Forward voltage changes with current and temperature, and a plotted curve may represent a typical sample rather than a guaranteed production limit. Reading the graph correctly turns a vague number into a useful component requirement.
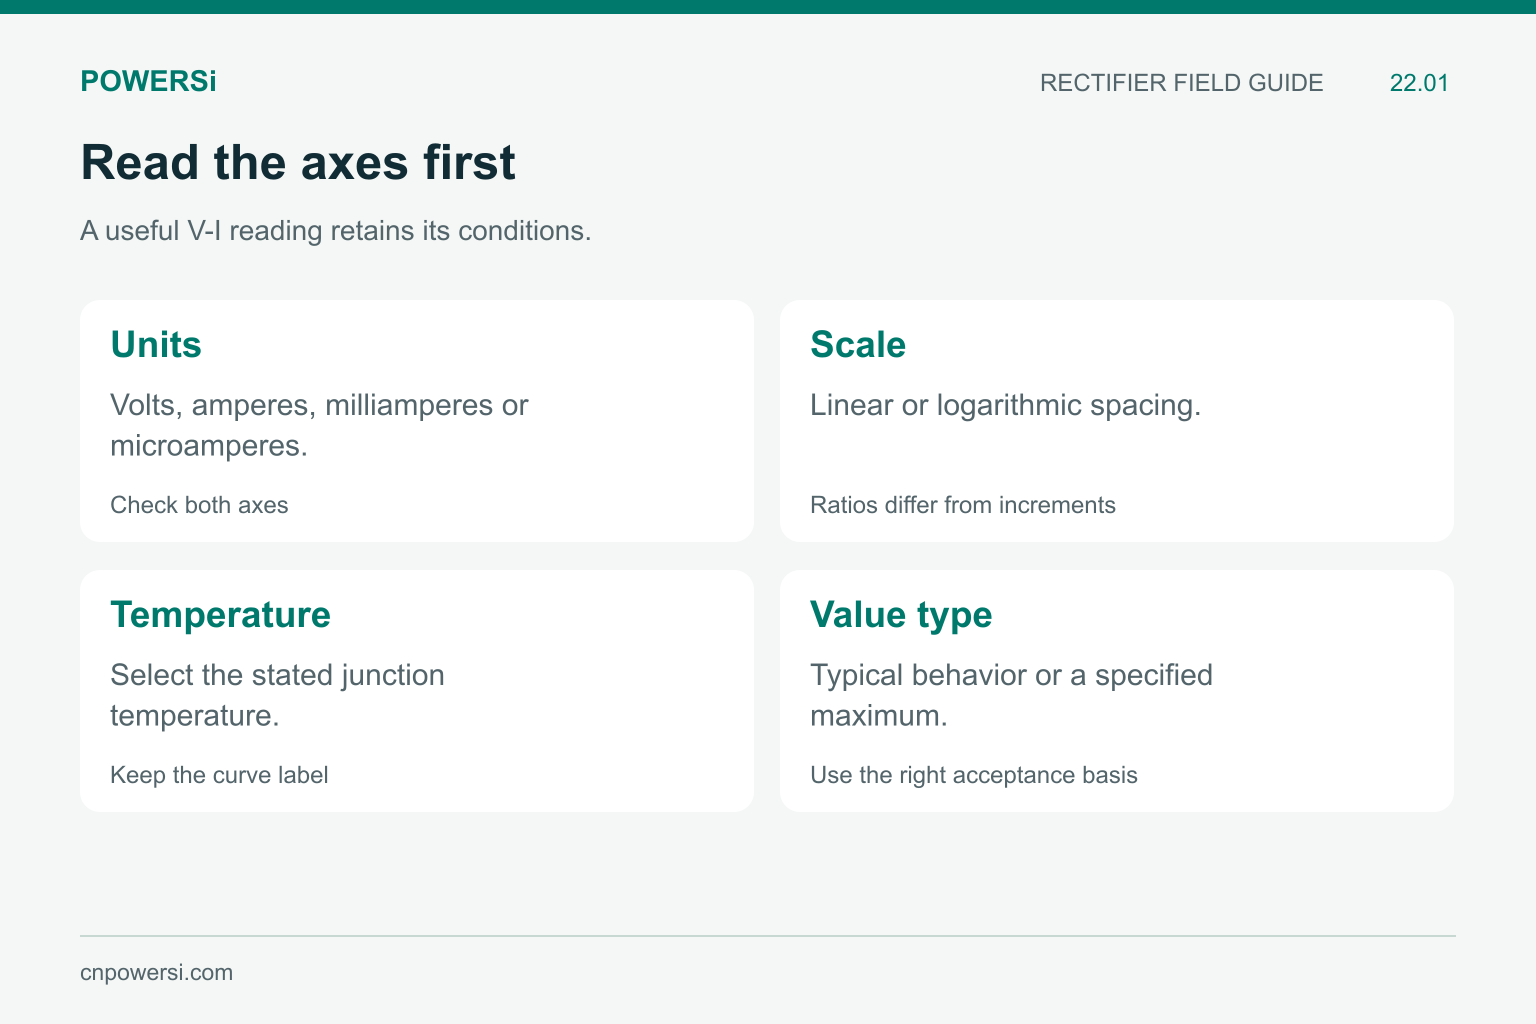
A useful V-I reading retains its conditions.
Read the Axes Before the Line
A forward characteristic usually plots forward current against forward voltage, but always read the labels. Some plots use current on a logarithmic axis. Equal vertical distances then represent equal ratios, not equal increases in amperes.
For example, the midpoint between 1 A and 10 A on a logarithmic current scale is about 3.16 A, not 5.5 A. Reading a logarithmic graph as linear can produce a large error even when the plotted line is clear. Check whether reverse-current units are amperes, milliamperes or microamperes as well.
Reverse characteristics may show positive magnitudes for both reverse voltage and leakage. That plotting convention does not mean the diode is forward biased. A percentage voltage axis must be converted using the device’s stated reference voltage before it becomes a voltage in volts.
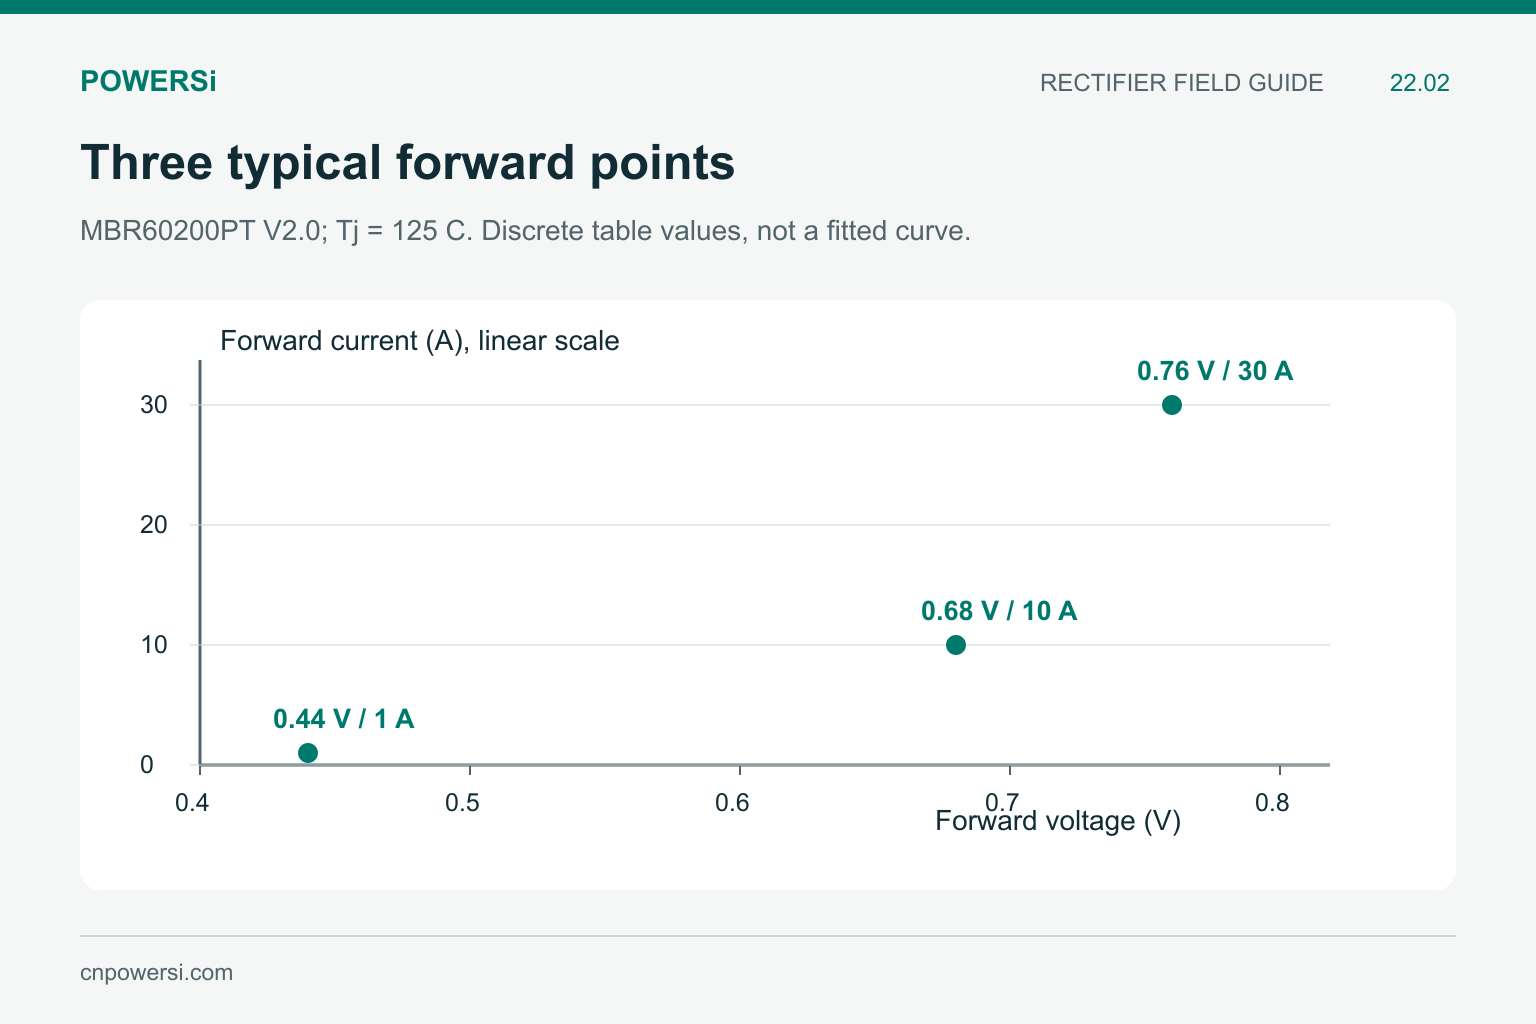
The plotted points reproduce typical table entries without implying intermediate guarantees.
Follow a Forward Operating Point
Start at the required current, move to the curve for the relevant junction temperature, and then read the forward voltage. Record the result as approximate when it comes from a graph. Do not extract more precision than the line width and axis spacing support.
The POWERSi MBR60200PT V2.0 table gives useful discrete examples: at Tj = 125°C, typical forward voltage is 0.44 V at 1 A, 0.68 V at 10 A and 0.76 V at 30 A. These are three conditioned typical entries. Joining them does not create a guaranteed curve for every production unit.
At IF = 30 A and Tj = 25°C, the table instead lists a maximum of 0.95 V. Comparing this maximum with the hot typical 0.76 V as if both were measured on one sample would confuse temperature effects with value type.
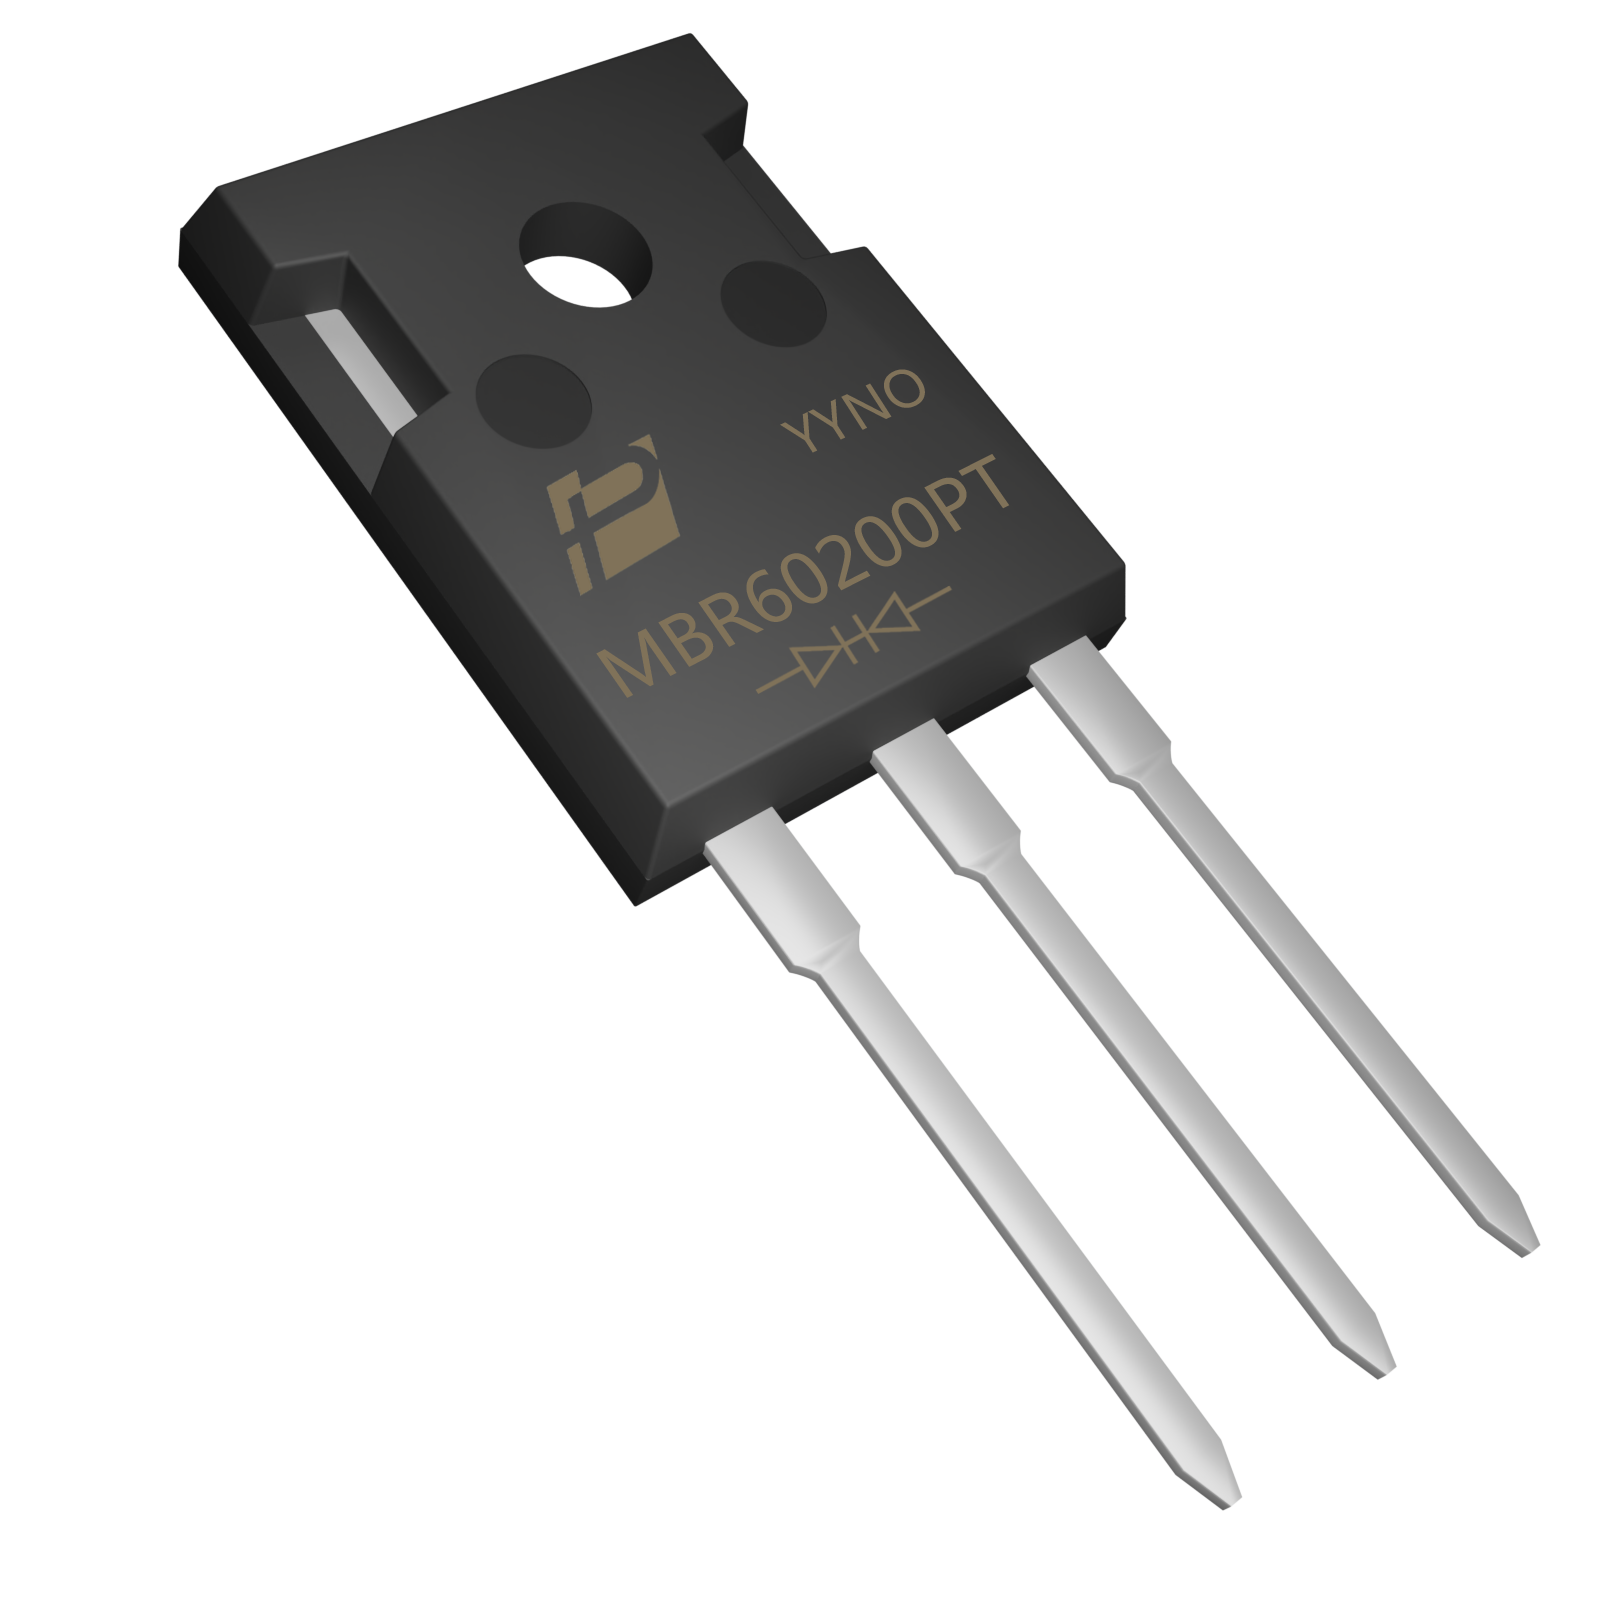
MBR60200PT original model image; the current scope is 30 A per diode and 60 A per device.
Keep Typical Curves and Acceptance Limits Separate
Use typical curves for understanding trends and initial estimates. Use an applicable guaranteed limit for a pass/fail specification. If an operating condition is not covered by a stated limit, a typical plot does not silently extend the guarantee to that point.
Also retain per-diode versus per-device scope. MBR60200PT has 30 A per-diode and 60 A per-device current entries. A buyer should not read a 30 A forward-voltage point as evidence that one junction has a 60 A continuous rating. Thermal conditions and the complete waveform remain part of current selection.
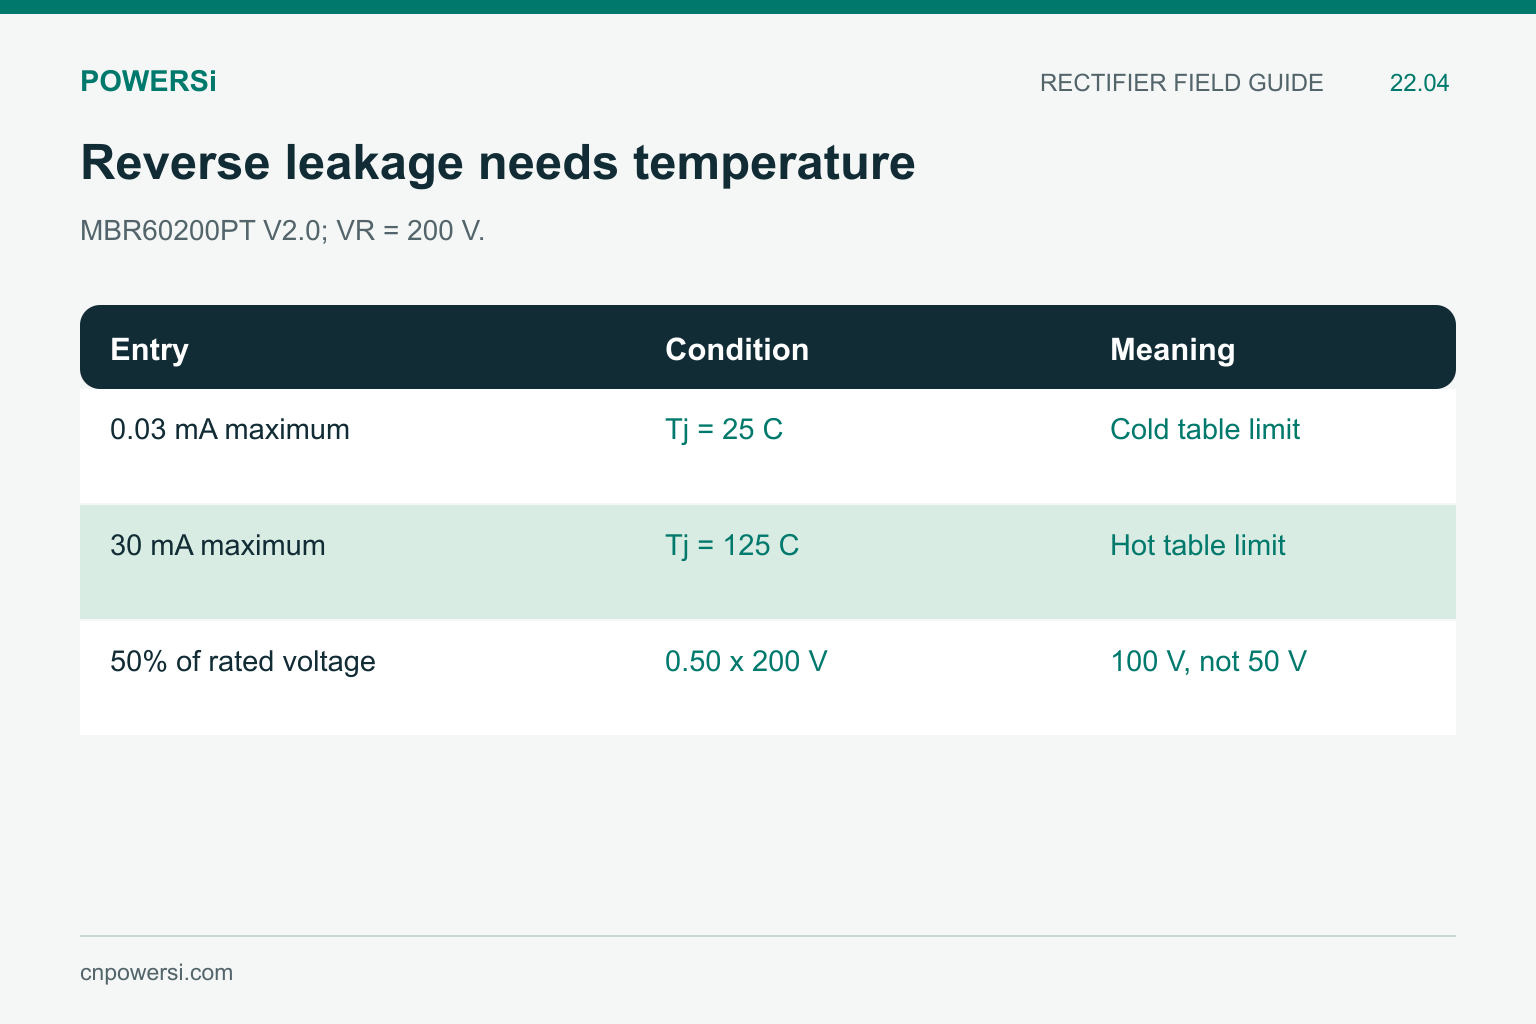
MBR60200PT V2.0; VR = 200 V.
Read Reverse Leakage With Its Temperature
For MBR60200PT, the reverse-leakage table specifies maximum values of 0.03 mA at Tj = 25°C and 30 mA at Tj = 125°C, both at VR = 200 V. These are limits at separate conditions; they are not a measured temperature sweep for one unit.
The typical reverse-characteristic plot uses a percentage of rated reverse voltage. For this 200 V device, 50% corresponds to 100 V. A curve marked 50% cannot be copied into a spreadsheet as 50 V. Keep its temperature label and current units with the extracted estimate.
Forward and reverse information answer different questions. A low forward drop does not by itself establish low hot leakage. A static V-I plot also does not supply reverse-recovery time or predict ringing during commutation.
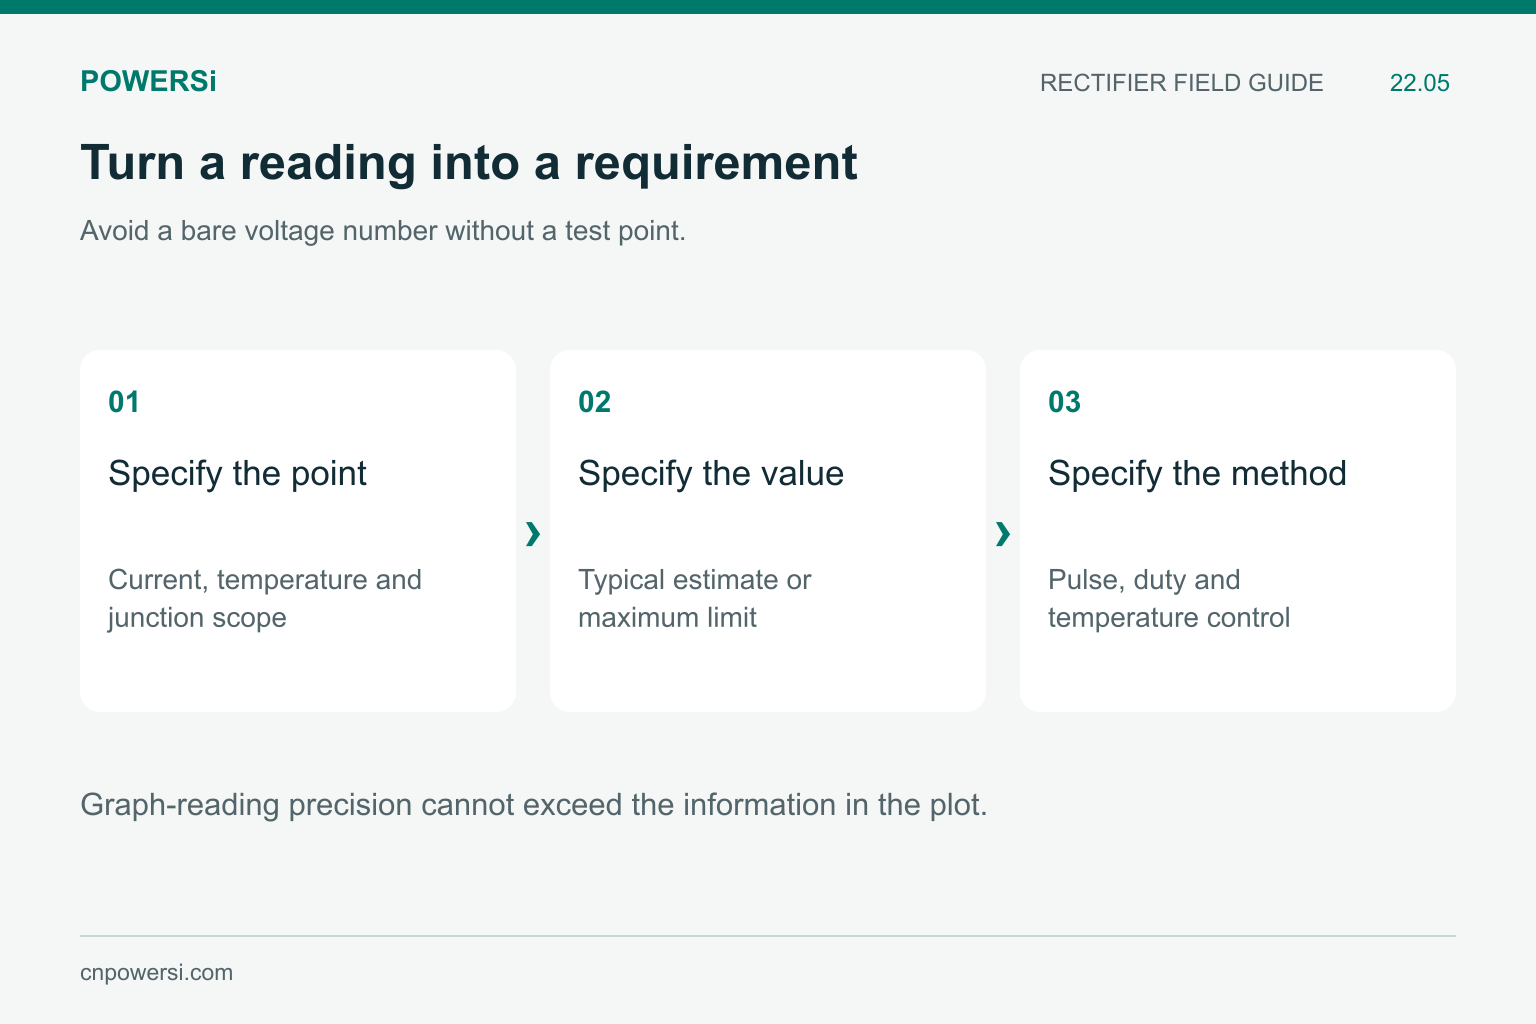
Graph-reading precision cannot exceed the information in the plot.
Convert the Reading Into a Useful Request
A useful requirement might say: “Maximum VF of 0.95 V at IF = 30 A and Tj = 25°C for the specified junction and test method.” That is more reproducible than “low VF.” Confirm pulse duration, duty and temperature control where they affect the measurement; self-heating can move the operating point.
For a pulsed load, conduction loss is the time average of v(t) multiplied by i(t). A single current-times-voltage estimate is appropriate only when its assumptions match the waveform. Do not use a static curve to approve a surge or reverse-energy event that requires a separate capability assessment.
Key Takeaways
- Check logarithmic scales and current units before reading values.
- Keep temperature and current attached to forward voltage.
- Typical plots and maximum limits serve different purposes.
- Convert percentage axes using the correct device reference.
Conclusion
A curve becomes useful when its conditions travel with the number. For a POWERSi component inquiry, state the required operating point, value type and thermal conditions so that a proposed alternative can be compared consistently.
FAQs
Is forward voltage a fixed property such as 0.7 V?
No. It depends on current, temperature, device construction and the measurement conditions.
Is the midpoint of a logarithmic axis an arithmetic average?
No. Between 1 and 10, the logarithmic midpoint is approximately 3.16.
Can a typical curve become a production acceptance limit?
Not by itself. Acceptance requires a specified limit and defined test conditions.
Does 50% reverse voltage mean 50 V?
Only if the reference voltage is 100 V. For a 200 V reference, it means 100 V.
Can a static V-I curve predict reverse recovery?
No. Dynamic commutation needs recovery or charge information and a suitable switching assessment.